2011/05/08

Downward Radiation From GHGs

An interesting paper from 2006

MEASUREMENTS OF THE RADIATIVE SURFACE FORCING OF CLIMATE
[...]
The measurements have been obtained using commercial Fourier-transform
infrared (FTIR) spectrometers. These measurements have been used to quantify
the radiative flux associated with a number of greenhouse gases. It is this radiative flux that provides an additional source of warming for the planet’s surface, and ultimately is responsible for any change in climate. We
have provided the first direct measurements of the greenhouse effect for a number of trace gases in the atmosphere. These gases include trichlorofluoromethane (CFC-11), dichlorodifluoromethane (CFC-12), carbon tetrachloride (CCl4), methane (CH4), nitrous oxide (N2O), carbon monoxide (CO), nitric acid (HNO3), and tropospheric ozone (Evans and Puckrin, 1994-1997; Puckrin et al., 1996). Not only do these results prove that an increase in the greenhouse effect is real, and that trace gases in the atmosphere are
adding a significant radiative burden to the energy budget of the atmosphere, but they also provide a means of validating the predictions that are made by global warming models (Ellingson et al., 1991).
[...]

4. CONCLUSIONS
Measurements of the downward radiative flux have been made for several
important greenhouse gases. At mid-latitudes in summer as compared to winter, our measurements show that the downward surface flux from H2O has doubled to 200 W/m2. The water increase causes a reduction
of the fluxes from the other greenhouse gases. These measurements show that the greenhouse effect from trace gases in the atmosphere is real and adds significantly to the radiative burden of the atmosphere. The greenhouse radiation has increased by approximately 3.52 W/m2 since pre-industrial
times. This compares favorably with a modeled prediction of 2.55 W/m2. Measurements such as these can provide a means by which to verify the predictions made by global warming models (Puckrin et al; 2004).

2011/05/06

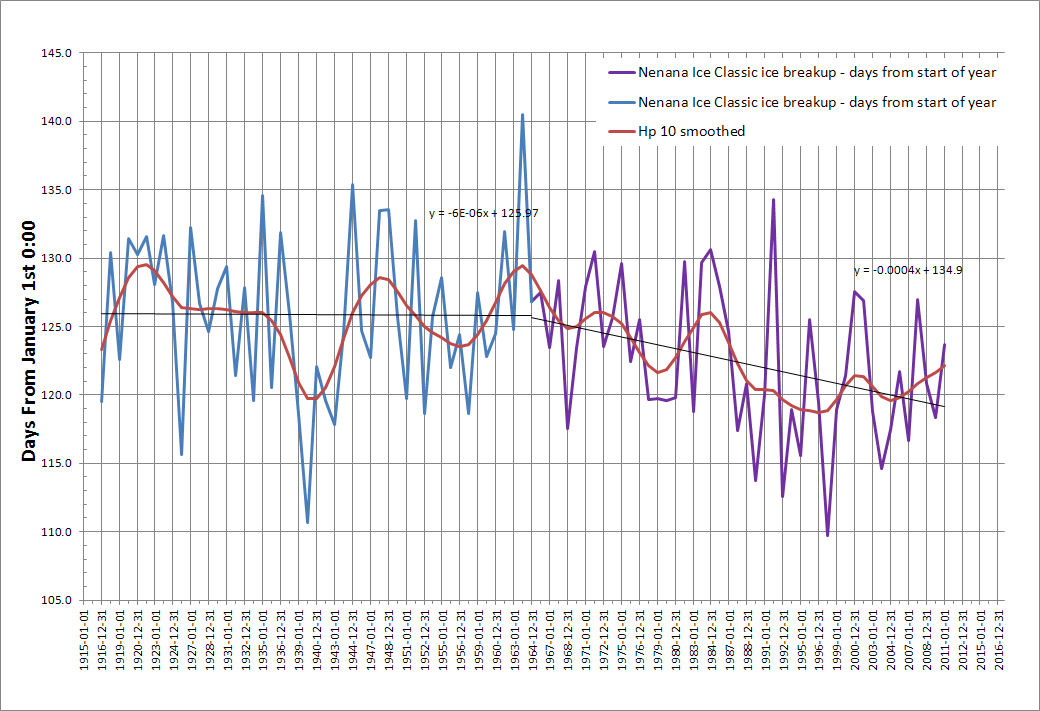
Nenana Ice Clasic - 2011

Results are in for this year - The Tanana River officially broke up and the ice moved interrupting the timer on 4th May 2011 at 16:24. This is later than GW would predict!

Changing plot to assume that last few years are a recovery!


[ps. watts refuses to post (or read?) items from me. Consequetly the greatest scientific blog on the web still shows that he cannot subtract 2 dates to give the breakup in days fromstart of the year. -
Here’s the context of the date in comparison with all of the others since 1917. (I calculated this to be day 124.683 in 2011, please check)
Actual count is 123.6833
Never mind no one notices anyway - what watts says is the truth even if wrong! CO2 snow anyone! (see this post)]

2011/05/03

Efficiency of power plant operating below capacity, start up times etc.

First a combined cycle gas turbine - not known for its efficiency at less than 100% of rated output.

http://www.gepower.com/prod_serv/products/tech_docs/en/downloads/ger3574g.pdf
Fast starting and loading is characteristic of STAG combined-cycle generation systems. This enables them to operate in mid-range, with daily start peaking service as well as baseload.

Typically, STAG systems can achieve full load within one hour during a hot start and within approximately three hours for a cold start.

Multi-shaft STAG systems allow the gas turbines to start independently of the steam cycle and provide about 65% of the plant capability within 15–25 minutes, depending on the size of the gas turbine, for hot, warm, and cold starts, as illustrated in Figure 36.Single-shaft STAG systems are started and loaded to full capacity in about the same time period as the multi-shaft STAG systems. The startup sequence and load profile for the single-shaft systems differ because the gas and steam turbines are started as a single integrated unit and not as two separate units. Single-shaft STAG startup is illustrated in Figure 37.


Now one designed for variable output

http://www.gepower.com/prod_serv/products/aero_turbines/en/downloads/lms100_brochure.pdf
The LMS100 is the Right Solution:
Outstanding full- and part-power efficiency
Low hot-day lapse rate
High availability – aero modular maintenance
Low maintenance cost
Designed for cycling applications
No cost penalty for starts and stops
Load-following capability
10 Minutes to full power
Improves average efficiency in cycling
Potential for spinning reserve credits
Reduced start-up emissions
Synchronous condenser capability


From the House Of Lords.

http://www.parliament.the-stationery-office.co.uk/pa/ld200708/ldselect/ldeconaf/195/19507.htm

101. The first cost imposed by intermittency is that more plant has to be held in reserve to cope with short-term fluctuations in output. At present, National Grid, which operates the electricity system,[34] keeps a number of power stations running at less than their full capacity, providing about 1 GW of spinning reserve—that is capacity which can automatically respond to any shortfall in generation within seconds (Q 293).[35] The company also contracts with other stations to start generation quickly and has arrangements with industrial consumers to reduce their demand at short notice, in order to restore the level of spinning reserves as soon as possible after they are used. The company holds about 2.5 GW of this standing reserve (Q 293); 70% of this comes from generation, and 30% from industrial consumers (p 144).

102. As the amount of wind generation rises, the potential short-term change in wind output will also increase, and National Grid will have to hold more reserve to cope with this increase. The company told us that if renewables provided 40% of electricity generation—the share the company believes would be needed to meet the EU's 2020 energy target—its total short-term reserve requirements would jump to between 7 and 10 GW. Most of this would be standing rather than spinning reserves. This would add £500 million to £1 billion to the annual cost of these reserves—known as balancing costs—which are now around £300 million a year (Q 293). This is equivalent to around 0.3 to 0.7 pence per kWh of renewable output.

103. Estimates of balancing costs vary widely. The government has commissioned research from the consultancy SKM,[36] which estimated that if renewables provided 34% of electricity by 2020, with 27.1% from wind power, the extra cost of short-term balancing would be about 1.4 p/kWh of wind output[37] (Q 481). This equates to a total cost of £1.4 billion, well above that assumed by National Grid. Several pieces of evidence cited a 2006 report by the UK Energy Research Centre (UKERC),[38] which had estimated the balancing costs with up to 20% of intermittent renewable output in Great Britain at 0.2-0.3 pence per kWh. Although the share of renewables in the SKM study was less than double that of UKERC, the balancing costs per unit were more than five times higher. In part, this may reflect higher fuel costs since the studies surveyed by UKERC were performed; but it will also reflect the greater challenges of dealing with larger shares of intermittent renewable generation.

So the costs of up to 20% wind is between £0.002 and £0.014 per kWh

The UK cost per kWh is approx £0.11

added 2011-11-24

2011/05/02

WUWT Revisionism

With all the noise that wuwt made about deleted pages on websites this happens:
Sidebar info
WUWT Readers Join Stickey-Note Activism
5 hours ago
This now goes to:

Not Found

Apologies, but the page you requested could not be found. Perhaps searching will help.

Forcing the side panel to bring up more info gives:
WUWT Readers Join Stickey-Note Activism - After reading “Ten Rules for Liberty Guerillas” and getting an invite to the original “gas-roots” event on Facebook, I launched a Post-It Note Activism at ...


Hmm I wonder what that is about
No google cache
No web archive (seems to have disabled that in case someone back-checks his blog?)


Google cache now (20110503) working - this is the garbage written:

Posted on by mikelorrey
After reading “Ten Rules for Liberty Guerillas” and getting an invite to the original “gas-roots” event on Facebook, I launched a Post-It Note Activism at the Gas Pump event for WUWT’s facebook group members to join in.


Stickey-note messages can be simple and to the point.

The mission is: carry a pad of post-it notes with you in your car, with a magic marker pen, so any time you stop at the gas pump, check your oil, go shopping at the market, etc and see an outrageous price (like what it costs to fill your gas tank), that you put a stickey note there with a snappy, catchy slogan to bring attention to people what the cost of unneeded climate regulations and taxes on carbon, energy, etc. is upon everyones pocketbooks.

Change the narrative...

Since starting this event and promoting it through our Facebook group, some of our down-under readers are picking up the ball to fight the carbon tax there in the same way. Don’t COP It Australia! is now promoting the idea.

Don't COP It! Australia! Gets into the fun...

Stickey-note activism is now going viral, because anybody can do it. You dont need big signs, you dont need lobbying money, or to live near a state or provincial capital. You dont have to stand around in the cold shouting at passing cars and getting honked at for looking silly. The post-it messages are small and inexpensive, but placed in high value places where people are feeling the hurt the most: at the gas pump, where gas prices have gone up more than 25% in recent months as Obama has illegally shut down offshore drilling, in contempt of court orders. Keep your slogans less than 7 words, keep it clean, the post-it note doesnt vandalize or deface anything, and it will be seen by many people using the gas pump or food stand you have just shopped at.

How is that Hope & Change working out for you?

2011/05/01

National grids reserves

From wiki
There is generally about 1.5 GW of so called spinning reserve
NG pays to have up to 8.5 GW of additional capacity available to start immediately but not running, referred to as warming or hot standby, that is ready to be used at short notice which could take half an hour to 2 hours to bring on line
A similar amount of power stations (8–10 GW by capacity) are operable from a cold start in about 12 hours for coal burning stations, and 2 hours for gas fired stations


Short term and instantaneous load and generation response mechanisms

The national grid is organized, and power stations distributed, in such a way as to cope with sudden, unforeseen and dramatic changes in either load or generation. It is designed to cope with the simultaneous or nearly simultaneous failure of 2 × 660 MW sets
Spinning Reserve National Grid pays to keep a number of large power station generators partly loaded.
Pumped Storage Pumped storage as in Dinorwig Power Station is also used in addition to spinning reserve to keep the system in balance.

Frequency Service For large perturbations, which can exceed the capability of spinning reserve, NG (National Grid plc) who operate the national grid and control the operations of power stations (but does not own them) has a number of partners who are known as NG Frequency Service, National Grid Reserve Service or reserve service participants. These are large power users such as steel works, cold stores, etc. who are happy to enter into a contract to be paid to be automatically disconnected from power supplies whenever grid frequency starts to fall.
Standing Reserve  Operating closely with NG Frequency Response is the National Grid Reserve Service now called STOR or Short Term Operating Reserve.[9] NG Standing Reserve participants are small diesel engine owners, and Open Cycle gas turbine generator owners, who are paid to start up and connect to the grid within 20 minutes from the time Frequency Response customers are called to disconnect. These participants must be reliable and able to stay on and run for an hour or so, with a repetition rate of 20 hours.

National Grid has about 500 MW of diesel generators on contract, and 150 MW of gas turbines with about 2,000 MW of disconnect-able load.[9]

Sources of intermittency on the UK National Grid The largest source of intermittency on the UK National Grid is the power stations; in fact, the single largest source is Sizewell B nuclear power station. Whenever Sizewell B is operating the entire 1.3 GW output is liable to stop at any time without warning. Its capacity is 2.16% of the national grid maximum demand, making it the single largest power source and therefore the largest source of intermittency. Despite this issue, NG readily copes with it using the methods outlined above including the use of diesel engines. An industry-wide rate of unplanned scrams (shutdowns) of 0.6 per 7000 hours critical means that such a shut-down without warning is expected to happen about once every year and a half.[11] However, no matter how low the rate of unplanned scrams, this is largely irrelevant - what matters is the fact that it can and does happen, and measures have to be in place to deal with it.

In 2008 both Sizewell and Longannet power stations both stopped unexpectedly within minutes of each other, in fact causing widespread power failures, as substations were tripped off using prearranged under-frequency relays.[12]

Reports of May 2008 outage
National grid http://www.nationalgrid.com/NR/rdonlyres/E19B4740-C056-4795-A567-91725ECF799B/32165/PublicFrequencyDeviationReport.pdf

Ofgem
http://www.ofgem.gov.uk/Markets/WhlMkts/CustandIndustry/DemSideWG/Documents1/National_Grid_-_System_Events_of_27_May_for_DSWG_16_July.pdf

Wind and National Grid stuff

http://webarchive.nationalarchives.gov.uk/+/http://www.berr.gov.uk/files/file15180.pdf

An example is given of a Eurostar train, which has a 5MW instantaneous change in demand when it goes from an accelerating phase to a coasting phase. This is compared to the largest fluctuation in an hourly interval observed from a large wind farm was only 20% of rated capacity. Thischange was also not an instantaneous change but a gradual reduction.


BM Start-Up

National Grid will offer BM Start-Up contractual arrangements to Generators for provision of 'energy readiness' capabilities that can be converted into timely energy utilisations, synchronised reserves or frequency response services.

Hot Standby
Following a generator’s start up preparation, it may be necessary to hold it for a period of time in a 'state of readiness' to generate at short notice. Under these circumstances, fuel will be used or energy taken to maintain this state of readiness. National Grid will offer 'hot standby' contractual terms to Generators who are able to maintain such a state of readiness and hence provide flexibility in the provision of timely energy utilisations, synchronised reserves or frequency response services.

Why is it needed?
An adequate Operating Margin is required at the day-ahead timescale, as contingent generation reserves in excess of forecast demand, to ensure that system security can be properly managed. BM Start-Up is used by National Grid in carrying out its residual balancing role to assist in ensuring sufficient plant availability on-the-day to meet demand plus reserve requirements.

Major Technical Requirements
BM Start-Up provider must:
Have the ability to take on warmth to reduce the time taken to synchronise to within Balancing Mechanism timescales.
Be able to maintain such a state of readiness to synchronise for an agreed period of time.

Fast Reserve


Fast Reserve provides the rapid and reliable delivery of active power through an increased output from generation or a reduction in consumption from demand sources, following receipt of an electronic despatch instruction from National Grid. Active power delivery must start within 2 minutes of the despatch instruction at a delivery rate in excess of 25MW/minute, and the reserve energy should be sustainable for a minimum of 15 minutes.
Fast Reserve is used, in addition to other energy balancing services, to control frequency changes that might arise from sudden, and sometimes unpredictable, changes in generation or demand.
Fast Reserve is procured via a monthly process and requires pre-qualification to establish a framework agreement prior to tendering.

http://www.nationalgrid.com/NR/rdonlyres/A2095E9F-A0B8-4FCB-8E66-6F698D429DC5/41470/NETSSYS2010allChapters.pdf

National Grid recognises the importance of climate change issues and that the government’s targets for growth in CHP and renewable generation are likely to lead to continuing increases in
embedded generation. It is important for National Grid to play its part in facilitating this by ensuring that any transmission issues arising are appropriately addressed. At present, no insurmountable transmission problems associated with accommodating new embedded generation projects are foreseen. Indeed, the properties of the interconnected transmission system are such as to facilitate embedded generation growth regardless of location.
Nevertheless, this does not preclude the potential need for reinforcements to the national electricity transmission system, the extent of which would be a function of the system location of the new plant. For example, the extent, and therefore cost, of transmission reinforcement would be a function of the volume of offshore wind located off the England and Wales coast or onshore wind located in Scotland. . There is considerable ongoing work in this area which is published by the Electricity Networks Strategy Group (ENSG):
http://www.ensg.gov.uk/index.php?article=126

National Grid’s responsibility in the Balancing Mechanism is to balance generation and demand and to resolve transmission constraints. The intermittent effect of wind (i.e. its output is naturally subject to fluctuation and unpredictability relative to the more traditional generation technologies) coupled with the expected significant diversity between regional variations in wind output means that, while the balancing task will become more onerous, the task should remain manageable. Provided that the necessary flexible generation and other balancing service providers remain available, there is no immediate technical reason why a large portfolio of wind generation cannot be managed in balancing timescales.
In the longer term, we do not think it likely that there will be a technical limit on the amount of wind that may be accommodated as a result of short term balancing issues, but economic and market factors will become increasingly important, most notably the potential impact of both the interim and enduring connect and manage regimes.

This site give a daily breakdown of the contribution of the various Renewable to California’s Total Demand.


The challenges of intermittency in North West European power markets

Wind turbine life cycle:
All the stuff anyone could ask for:
http://www.vestas.com/en/about-vestas/sustainability/wind-turbines-and-the-environment/life-cycle-assessment-(lca).aspx

The most recent Life Cycle Analysis is here for a 3MW Standard machine.


From the Vestas web page
 
Our aim is to develop an increasingly efficient range of turbines that produce energy as effectively as possible. In doing so, we constantly strive to minimise the consumption of raw materials used in manufacturing.

Wind power makes minimal environmental impact
Taking the long term view, the impact on the environment for a wind turbine life cycle of 20-25 years is minimal when compared to that from average European electricity production by other means. This is based on considerations such as:

  • Manufacturing of raw materials
  • Production of components
  • The wind turbine’s energy production
  • Decommissioning of the wind turbine

Of course, the use of raw materials in manufacturing a wind turbine has a negative impact on the environment – as does the production of any form of plant. Balanced against this is the fact that as much as 80 per cent of some turbines are recyclable. But most important of all are the undisputed positive environmental benefits that come from clean and renewable wind power.

For example, a V90-3.0 MW offshore wind turbine will pay for itself more than 35 times during its lifetime – producing 284,600 MWh over the course of 20 years in a good location. To put this in perspective, that’s equivalent to the combined average annual electricity consumption of more than 84,000 Danish households*.

*Source: Energy Statistics [Energistatistik 2004], published by the Danish Energy Authority [Energistyrelsen]


LCA reports and environmental product declaration

In keeping with our belief in transparency, we’ve published LCA reports on two of our wind turbine types – the V80-2.0 MW and V90-3.0 MW. The report for V80-2.0 MW was prepared in collaboration with the consulting firm Elsam Engineering A/S, with the life cycle assessment being prepared according to ISO 14040-43*. An external consultant conducted a critical review of the calculations. We have also produced an environmental product declaration (EPD) for the V90-3.0 MW wind turbine, which contains the most important conclusions from the LCA report.

*The reports lives up to all the standards in ISO 14040-43 with the exception of the examination by interested parties, which was not conducted.

 Neodymium - no way

ENERCON news  ENERCON WECs produce clean energy without neodymium
29.04. 2011
ENERCON wind energy converters (WECs) generate electricity in an environmentally friendly way without the use of the controversial element, neodymium. The gearless WEC design on which all WEC types – from the E-33/330 kW to the E-126/7.5 MW – are based includes a separately excited annular generator. The magnetic fields required by the generator to produce electricity are created electrically. By design, and unlike the majority of competing products, ENERCON WECs do without permanent magnets whose production requires neodymium.
Neodymium has made the headlines recently because its extraction partly involves significant environmental damage. China, where neodymium-containing rocks are quarried in mines, is the main supplier of this so-called rare earth element. According to investigations by Germany’s NDR TV station, separation of neodymium from mined rocks results in toxic waste products (Menschen und Schlagzeilen and Panorama television magazines aired on 27 and 28 April). In addition, radioactive uranium and thorium are released by the mining process. These substances find their way into the ground water, heavily contaminating plant and animal life. They are seen as harmful to humans. According to the reports, part of the locals at the neodymium production sites in Baotou in northern China are already seriously ill.
ENERCON feels that these environmental and health aspects support its choice of WEC design. “We are a high-tech company that sets great store by environmental protection,” says ENERCON Managing Director Hans-Dieter Kettwig. “Our choice to rely on separately excited generators was the right one, not only from a technological but also from an environmental point of view.” According to Kettwig, renewable energies need to be viewed in their entirety in order to offer a convincing alternative. Producing clean energy is one thing; however, sustainability in production is just as important.


From UK ofgem
http://www.ofgem.gov.uk/Sustainability/Environment/Policy/Documents1/Renewable%20Energy%20Strategy%20response.pdf
The scale of the challenge today


1.39. According to NGET, an increase in intermittent forms of generation such as wind will increase its balancing costs through reserve costs, frequency response, and constraints costs.2 NGET did not specifically measure the contribution made by wind to its System Operator costs in 2007-08, but it estimated that the reserve costs associated with the 2.5GW of installed wind capacity were around £17m. It further estimated that the additional costs of the 500MW of extra wind capacity that are expected to be operational in 2008-09 will increase its costs by a further £10m. The majority of this increase (£8m) would be spent on ensuring sufficient reserve generation, which is required due to the high error factor associated with wind forecasting, £2m of the increase would result from fast reserve and frequency response costs, and around £70k would be spent on constraint costs3.

1.40. It is likely that the annual cost of reserve will increase significantly as the proportion of wind generation increases. Predictions for future costs range from £4-£7.50 for each additional MWh of wind placed on the system4. A cost of £7.50/MWh applied to the projected level of wind capacity of 14 GW by 2014-15 would cost an additional £275m in balancing costs in that year (assuming a 30% load factor). By way of comparison, balancing costs for the whole system in 2008/09 are forecast to be around £530m. The challenge therefore, is to ensure appropriate incentives are in place to ensure these costs are managed and the available reserve capacity is used in the most efficient way. This is manageable under current arrangements.

From a FOI request real data for a 1MW machine

http://blog.silverford.com/2011/02/balloo-enercon-wind-turbine-bangor-northern-ireland-stats-figures-and-price/


£889,650 turbine cost

£434,583 planning and consultancy

maintenance cost €0.0055 per kilowatt hour - 12 year guarantee

As reported to Council in December 2009 a pay-back period of approximately 7-8 years has been calculated. This is based on a full capital cost of £890,000 and a basic provision of £30,000 to cover routine expenditure


Lots more info in link


2011/04/28

Unwinding hide the decline

Well worth a look

2011/04/26

Oh Dear 4

More vitriol allowed on WUWT wrt Santer
Smokey says:  April 25, 2011 at 7:20 pm
...
True dat. Santer is a real vermin, one of the most despicable Climategate worms. This is a real indictment of the formerly great AGU, which has sold its soul to Mammon.
=============================
John Blake says: April 25, 2011 at 7:30 pm

Santer remains a blinkered ideologue, concerned not to promote objective scientific inquiry but to make his Green Gang bones preparatory to foisting willfully ruinous damage on coal, oil, nuclear energy economies in Gaia’s name.

Whatever Luddite sociopathology drives climate cultists to sabotage human ease-and-comfort at every opportunity, Santer exhibits it in spades. Like Briffa, Hansen, Jones, Mann, Trenberth et al. he is complicit in the most massive, savagely destructive fraud in human history
============================
Pamela Gray says: April 25, 2011 at 7:16 pm

I’ve been privy to the spectacle of seeing all kinds of accolades being directed to first class jerks. And have sometimes been at the receiving end of “jerk” intelligence and their special kind of superiority. It seems to be a fact of life that those who find being a jerk a rewarding way of life also tend to be at the top of a pile.
============================
And now showing at CA
Pete  Posted Apr 26, 2011 at 3:50 AM
You are totally wrong on a number of counts. This body of work has massive impact on public policy and there is continuing public interest, and I would contend a requirement for full disclosure. The University is also a public body and receives grants for it’s work from numerous public sources.

Apart from this there are significant grounds to suspect dishonest or corrupt practice at this institution.
============================
and
Henry Posted Apr 27, 2011 at 5:39 AM
Almost all of these AGW nuts especially academics are card carrying communist the idea that their protecting the sanctity of private property is too funny.
============================
SteveGinIL Posted Apr 24, 2011 at 11:57 PM
...
Lying scientifically means fudging the data, mostly. And no other scientific filed [field?] would give that a pass.
============================
Anthony Watts says:  June 2, 2011 at 6:19 pm

I’m now of the opinion that Nick Stokes is either disingenuous or deranged in his thought processes, such as selective memory.
=============================
Chris Colose
This is WUWT I guess…whatever


REPLY: This is Chris Colose, inexperienced student, http://www.aos.wisc.edu/~colose/ whatever. – Anthony
.......
You obviously know how I feel about you and your blog, and the level of scientific understanding here, so the insults are pointless. I will do my best to suspend my anger at some of the things people are spoon-fed (and that they actually eat) daily.


REPLY: You are right, your predictable insults are pointless, so stop it and take it up with Dr. Gray rather than dissing me for publishing his essay at his request. Consensus does not equal fact, and the moment consensus replaces empirically proven facts in science, science is lost. – Anthony

....
REPLY: He’s not at GISS, which is in NYC, he’s in Madison at UW, Home of McIdas and SEIU riots taking over the capital and all that. – Anthony

==================

Joshua says: August 29, 2011 at 11:57 am
....
…simply because you don’t like Pat Michaels and are too much of a coward to put your own full name to posts- Yes he made a gaffe, then corrected it, now move on.

OK. Pat Michaels isn’t a “coward” because he uses his own name when he writes a comment about only 8 bodies being “coughed up?”

Gaffe? Really? You call that a “gaffe?”

And I think that “scrubbed” is more accurate than “correction.” Did he make a statement about his original phrasing, or was his post just silently edited?

REPLY: Scrubbed would imply removal. Correction is changing words/spelling. Now if you have something to discuss about TV media, then discuss it, otherwise take a hike. I get tired of your thread jackings here. Note the policy page. Note there I state WUWT has a low tolerance level for people using taxpayer funded resources to spout snark from the comfort of anonymity. – Anthony
-------------------------------
 uknowispeaksense says:
  1. Is this what all the hype was about? A poorly written manuscript yet to be submitted? I am genuinely curious though, which journal does Anthony think this manuscript is going to be published in? The formatting is terrible.

    REPLY:
    We are all still waiting for you to produce something of value other than whining from behind the curtain of anonymity.
    Everyone should have a look at this on his blog to know the kind of person he is: Denier Comment of the Day July 30, 2012
    Step of or shut is always a good policy I think. Write your own paper, make a difference. leave a note when you have substances, because I don’t have to take the sort of juvenile abuse you write on the blog of yours. Not my “living room policy” on the policy page, I’m showing you the door. I’m also going to drop a note to Charles Sturt Univeristy to advise them of your abuse of their AUP. – Anthony
He's really getting rattled these days:

James Humbolt says:

“Moderator REP says:
August 1, 2012 at 7:52 pm
Jan P Perlwitz says: August 1, 2012 at 5:54 pm
Or is this a subtle try to intimidate me by bringing my employer into the argument? BTW: Who do you think is my employer anyway?
Jeez…. unless the budget cuts bit deeper than we thought or you developed a conscience, everybody and his brother knows you work for NASA/GISS.”
So once again, the MO here appears to be that if you agree with the work, anonymous review is fine, but as soon as significant or legitimate criticisms appear, you find it necessary to make a point of hunting down and exposing/blackmailing identities. This is DISGUSTING, and of course will not be a tactic available to you in peer review.
REPLY: Mr. H- whatever. You really want to go this way? Fine. Dr. Perlwitz is well known and well-respected in this community. It really doesn’t matter if he adheres to our “line” or not, he has my respect and that of many others. You can vehemently disagree with him, but if you try to silence him you may run into more of a problem than you thought. Dr. Perlwitz puts his name on his words.
You, on the other hand, are a sock puppet. Young Mr. Roberts is more than welcome to comment here… but if young Mr. Roberts wants to play stupid games, fine. His information gets dumped. One last warning, Mr. Roberts…. before I was allowed to be a moderator here, I made a comment in seven or eight different languages that in the cold light of morning I begged Charles to remove. Anonymity doesn’t make you free, it makes you stupid. One more humbolt comment like this and your contact information gets published.
Actually, that’s not gonna happen. but you are pushing the envelope. -REP

Hmmm -  I seem to remember his email getting published as well - more secret snipping!!!


2011/04/22

Hiding the Decline in full view

From 2005
http://climateaudit.org/2005/03/27/briffas-tornetrask-reconstruction/
http://climateaudit.org/2005/05/01/a-strange-truncation-of-the-briffa-mxd-series/

From 2006

http://climateaudit.org/2006/12/30/briffa-et-al-2001-more-on-divergence/
Briffa et al 2001 – More on Divergence
After several years of trying, Briffa and Osborn have finally listed the sites used in Briffa et al 2001 and related publications. Briffa had reported results on large networks of over 300 sites collected by Schweingruber. Schweingruber had archived over 400 sites at WDCP.

.... One of the first exercises that I carried out was to calculate a simple average of all the available ring width chronologies in the Briffa et al 2001 network (369 sites – 387 less the 18 unavailable sites.) In this case, I just used the Schweingruber chronologies without trying to re-do using RCS chronologies.

Here’s the result. As you see, there is a noticeable decline in the late 20th century – the “divergence problem.” If this is the average of a large sample of 369 sites, what are the odds that a random selection of say 8 sites has a sharp uptick in the late 20th century. Not very

2011/04/20

AMSRE Sea Ice Plots 2011


This years area is following the same path as recent previous years - the area is increasing until the 1st week in May and then rapidly falling.Is this due to thin ice separating into small blocks which drift apart but stay above the 15% ice concentration? This would then be quicker to melt than large blocks.

A plot showing a few selected days changes over time - note that 7th May has a significant positive slope!

A plot of rate of change per day - area starts shrinking around 7th March and starts growing around 17th September

The usual Extent plot!

2011/04/16

More on Astroturfing

In no particular order:


Koch Involvement!


2011/04/07

Leif Svalgaard on Its the sun what did it

the video

Leif Svalgaard says: April 5, 2011 at 7:54 pm

This is well-trodden ground. Nothing new to add, just the same old, tired arguments. Perhaps a note on EUV: as you can see here (slide 13)
 http://lasp.colorado.edu/sorce/news/2008ScienceMeeting/doc/Session1/S1_03_Kopp.pdf
the energy in the EUV band [and other UV bands] is very tiny; many orders of magnitude less than what shines down on our heads each day. So a larger solar cycle variation of EUV does not make any significant difference in the energy budget.

Leif Svalgaard says:  April 6, 2011 at 10:16 am

It is not clear what his [Courtillot] theory is. I have come across two claims he makes: 1) the Earth’s magnetic field determines climate, and 2) cosmic rays determines climate. Now, it is of no use to discuss this if the influences are minor [because we are interested in the major drivers], so the issue is not if some subtle influence can be found by suitable massaging/filtering/torturing/misrepresentation etc of the [often dubious data and more dubious proxies], but whether such influence is large enough that is swamps anything else [otherwise we need no worry, e.g. if AGW is really larger than the solar influence, then who cares about the Sun]. The cosmic ray issue is clouded [no pun!] by the fact that the cosmic ray intensity is primarily controlled by the intensity of the Earth’s magnetic field, and not by the Sun [ignoring galactic changes, supernovae, aliens, etc]: http://www.leif.org/research/CosmicRays-GeoDipole.jpg the little wiggles are solar related, the big swing is not. Anyway, what should matter is what the GCR intensity actually is in the troposphere where clouds are formed and not what causes the GCRs. We do not have good measurements of GCRs before the 1950s [the early measurements back to the 1930s have uncertain calibration], but there have been no long-term changes in GCRs since then [the solar cycle changes are only a few percent anyway], e.g.
http://www.leif.org/research/Cosmic%20Ray%20Count%20for%20Different%20Stations.png
 . Also, solar activity [and the solar wind and magnetic flux, etc] right now is on par with what it was in the 19th century [ http://www.leif.org/research/2009JA015069.pdf , Figure 10], yet the climate is claimed to be significantly warmer now, contrary to what we would expect from a cosmic ray variation. So, for me, there is precious little observational evidence for the GCR theory.

2011/03/21

holding post for a briffa fest + other posts

Repository of posts (and other stuff) sent to McIntyres blog - they sometimes get deleted!!!
=========================================
thefordprefect Posted Mar 31, 2011 at 8:40 PM

Some time ago I did an experiment using a digital camera at night (the camera tries to adjust for the lack of light by making the sensor more sensitive. this allows random thermal noise to produce the typical digital noise on such photos - this can only be reduced by operating the sensor at ultra low temperatures)


It is a good technique for producing pictures in near impossible conditions - take a binary number of photos, combine them in pairs using the "add" function in paintshop pro, take each summed photo and add to another summed photo. Continue adding together only 2 photos at a time until the required result is obtained.
What was the purpose:
To show that a signal buried in random noise can be extracted by averaging over many data sources.

I.e. take enough trees. Average the ring data and any common factors in the data may become visible - fertilisation, lack of nutrients; too much water, too little water; etc get reduced. but the temperature/CO2 fertilisation are not locally different and any of these or similar effects should become dominant in the averaged data. By junking obvious non responders (invalid photos of kids etc) the common signal is obtained more quickly. We what the temperature has done over the last few hundred years - is it therefore wrong to dump trees that do not conform? I knew that my photos contained no ships so why should I average my ship photos into the photo of the back garden?


Does anyone suggest that a proxy record is an exact representation of past temperatures - I have not seen such words used. All these proxies are simply work in progress (and done over a decade ago!). Reports generated a decade ago are not necessarily fixed in stone more recent ideas/data can displace such ancient documents. Why are these constantly paraded before us?


The photo experiment can be seen here:

http://climateandstuff.blogspot.com/2009/10/noise-tree-rings-and-stuff.html
================================================
I see no magenta style plot on these papers – can you direct me to the correct one please?

Seeing the Wood from the Trees
Keith R. Briffa and Timothy J. Osborn*
http://www.sciencemag.org/content/284/5416/926.full?ijkey=c5d71e39f7f85ed34e518d0ce7473549cc903585&keytype2=tf_ipsecsha


High-resolution palaeoclimatic records for the last millennium: interpretation, integration and comparison with General Circulation Model control-run temperatures
P. D. Jones, K. R. Briffa, T. P. Barnett and S. F. B. Tett The Holocene 1998
http://hol.sagepub.com/content/8/4/455.full.pdf

Low frequencty temperature variations from a northern tree ring density network
Briffa et al 2001
http://www.cru.uea.ac.uk/cru/people/briffa/jgr2001/Briffa2001.pdf

from the blog:
thefordprefect Posted Mar 26, 2011 at 7:52 AM
I’ll reply here but it will probably get pulled.
Watts is observing the current state of temperature proxies (LIG thermometers, Pt resistance thermometers, Thermistors etc in various enclosures. These all respond in a certain way to temperature – not always linear (lig will have a boiling point where it becomes decidedly non linear. They are all placed over different surfaces Snow, rain, grass growth, new tarmac, etc will all influence the air temperature measured.
Watts then removes manually any he considers does not CURRENTLY (and have not in the past?) meet the standards he is applying (cherry picking). This leaves the “good reponder” proxies.
All thermometers require calibration against kmown standards

Briffa does not have this luxury. His proxies are dead trees – there is no possibility of determining which are to be good proxies for their life. Rivers may change course affecting the water table. All trees have a inverted cup shape growth with temperature. There will be an optimum below and above which growth rates will be lower. This optimum will depend on available nutrients, surrounding competition etc. all of which will change over the life of the tree.
Trees need calibrating against known standards – the intrumental data.

McIntyre’s blog has already castigated Briffa for throwing away trees that are not good proxies (cherry picking). This leaves the good proxies. Briffa is now being called “names” for removing bad data that does not give a good proxy for temperature but which is taken from trees that for some of the period are good responders. This sounds very much like Watts is doing!

The plot Hodrick-Prescott Filtered cf 50 year average taken from data on second page of spreadsheet residing in the basement repository with "beware tigers" on the door. No info Just Briffa et al as a column heading - was this published, was this an intermediary file. Who knows? McIntyre does NOT. But McIntryre assumes much! Also chose your smoothing and end padding to get the results you require.

data from
ftp://ftp.ncdc.noaa.gov/pub/data/paleo/contributions_by_author/jones1998/jonesdata.xls


Adding in the data suggested by commenter with more severe filtering to untangle the spagetti a bit

http://www.cru.uea.ac.uk/cru/people/briffa/jgr2001/jgrdata2


A link to AR4 where the failing data is discussed:

to WUWT 11-05-03
Richard S Courtney says: May 2, 2011 at 5:00 pm


Wind farms are expensive, polluting, environmentally damaging bird swatters that produce no useful electricity at any time: they merely displace power stations onto standby mode (when the power stations continue to consume their fuel and to produce their emissions) during the periods when the wind is strong enough but not too strong for the wind turbines to generate electricity.
What do you not understand about conservation of resources. A power station runing without producing power (spinning reserve, warm start) consumes very little energy to when fully loaded. This surely is obvious? Otherwise where does the excess fuel energy go?
The RSPB consider a correctly placed windturbine to be OK.
How many birds do windows on your house wipe out (we get perhaps 4 deaths/year despite stickers on the panes).
How many birds/animals does your traveling in road vehicles wipe out?
What is the "bird slicers" to vehicles/homes ratio?
What evidence do you have that wind turbines are polluting. According to Vestas 80% of a turbine can be recycled.
From Vestas web site:

For example, a V90-3.0 MW offshore wind turbine will pay for itself more than 35 times during its lifetime – producing 284,600 MWh over the course of 20 years in
The complete life cycle analysis of a wind turbine:

http://www.vestas.com/Admin/Public/DWSDownload.aspx?File=%2fFiles%2fFiler%2fEN%2fSustainability%2fLCA%2fLCA_V112_Study_Report_2011.pdf

Neodymium is not always used:

ENERCON news ENERCON WECs produce clean energy without neodymium

29.04. 2011

ENERCON wind energy converters (WECs) generate electricity in an environmentally friendly way without the use of the controversial element, neodymium. The gearless WEC design on which all WEC types – from the E-33/330 kW to the E-126/7.5 MW – are based includes a separately excited annular generator. The magnetic fields required by the generator to produce electricity are created electrically. By design, and unlike the majority of competing products, ENERCON WECs do without permanent magnets whose production requires neodymium.
No one thinks that a 1kW generator will produce economic electricity to the grid. But connect up a 3+MW generator and for the 28% of the time it produces power it is saving an equivalent in fossil fuels that future generations can use. Is this a bad thing?
No one expects a few hundred turbines to REPLACE fossil/nuclear generators. All know that there are times of no wind. BUT they do displace convenient energy to the future. And they do reduce all pollution.
All those you tube videos of burning and destructing turbines are good propaganda but one has to compare the permanent exclusion zone round a failed turbine to the exclusion zone round a failed reactor.
thefordprefect


Posted May 24, 2011 at 7:03 AM
Your comment is awaiting moderation.

Mosher,
Good grief this is getting ridiculous!
If I wrote a paper on the JET fusion processes and why I need to use beryllium tungsten walls.
Who would review it – geologists? research chemists? joe bloggs, the blogging king?, or would it be other researchers in the field of fusion reactions and material scientists.
Would I know these others?
Yes.
I would be in email, telephonic, and even social contact with them. Some would even be friends! Pals (to you).


For you to complain about my reviewers, you would have to call them dishonest. Would you be prepared to do that?
You ARE prepared to do that to climate scientist reviewers.

2011/03/08

Online personas

http://www.seankerrigan.com/docs/PersonaManagementSoftware.pdf
Solicitation Number:
RTB220610
Notice Type:
Sources Sought
Synopsis:
Added: Jun 22, 2010 1:42 pm Modified: Jun 22, 2010 2:07 pm Track Changes
0001- Online Persona Management Service. 50 User Licenses, 10 Personas per
user.
Software will allow 10 personas per user, replete with background , history,
supporting details, and cyber presences that are technically, culturally and
geographacilly consistent. Individual applications will enable an operator to
exercise a number of different online persons from the same workstation and
without fear of being discovered by sophisticated adversaries. Personas must be
able to appear to originate in nearly any part of the world and can interact through
conventional online services and social media platforms. The service includes a
user friendly application environment to maximize the user's situational
awareness by displaying real-time local information.
0002- Secure Virtual Private Network (VPN). 1 each
VPN provides the ability for users to daily and automatically obtain randomly
selected
IP addresses through which they can access the internet. The daily rotation of
the user s IP address prevents compromise during observation of likely or
targeted web sites or services, while hiding the existence of the operation. In
addition, may provide traffic mixing, blending the user s traffic with traffic from
multitudes of users from outside the organization. This traffic blending provides
excellent cover and powerful deniability. Anonymizer Enterprise Chameleon or
equal
0003- Static IP Address Management. 50 each
Licence protects the identity of government agencies and enterprise
organizations. Enables organizations to manage their persistent online personas
by assigning static IP addresses to each persona. Individuals can perform
static impersonations, which allow them to look like the same person over time.
Also allows organizations that frequent same site/service often to easily switch IP
addresses to look like ordinary users as opposed to one organization.
Anonymizer IP Mapper License or equal
Contracting Office Address:
2606 Brown Pelican Ave.
MacDill AFB, Florida 33621-5000
United States
Place of Performance:
Performance will be at MacDIll AFB, Kabul, Afghanistan and Baghdad, Iraq.
MacDill AFB , Florida 33679
United States
operating within and which allow a customer?s online persona(s) to appear to
originate from. Ability to provide virtual private servers that are procured using
commercial hosting centers around the world and which are established
anonymously. Once procured, the geosite is incorporated into the network and
integrated within the customers environment and ready for use by the customer.
Unless specifically designated as shared, locations are dedicated for use by
each customer and never shared among other customers. Anonymizer Annual
Dedicated OCONUS Light Geosite or equal
0006- Remote Access Secure Virtual Private Network. 1 each
Secure Operating Environment provides a reliable and protected computing
environment from which to stage and conduct operations. Every session uses a
clean Virtual Machine (VM) image. The solution is accessed through sets of
Virtual Private Network (VPN) devices located at each Customer facility. The
fully-managed VDI (Virtual Desktop Infrastructure) is an environment that allows
users remote access from their desktop into a VM. Upon session termination,
the VM is deleted and any virus, worm, or malicious software that the user
inadvertently downloaded is destroyed. Anonymizer Virtual Desktop
Infrastructure (VDI) Solution or equal.
Primary Point of Contact.:
Russell Beasley,

then there is Hbgary:
http://search.hbgary.anonleaks.ch/

in email
1297006350.M265530P14101Q3005.cybercom
How to create a persona background

1296969913.M375202P7284Q224.cybercom
get some malware source code, modify it, distribute it with one personna, the call-out with another.

Etc.

2011/03/02

WUWT - A science blog of note

In entry:
Rebuttal to the Skeptical Science “Crux of a Core”

Posted on March 1, 2011 by Anthony Watts
Guest post by Dr. J Storrs Hall

http://wattsupwiththat.com/2011/03/01/rebuttal-to-the-skeptical-science-crux-of-a-core/

There is this gem of a scientific annotation to this graph:


(This is GISP2 in green, NGRIP, another Greenland core, in cyan, and the Vostok Antarctic core in blue. The Vostok has been scaled and shifted for a best match with the others; the temperature in Antarctica is colder, with smaller variations, than in Greenland. Furthermore, there are some time-scaling issues — note the temporal divergence of the two Greenland records before about 40 kya. It’s possible that NH/SH actually match better than this plot indicates.  Look here for data.)
 
Consider the supposed desecration of science of hide the decline - see earlier post
 
Storrs Hall
has invisibly shifted a whole data set in time.
has changed the data scaling of a data set
Has used 2 locations on the globe only to prove that AGW is a fraud.
 
Not one post points this out!!!!!!