Showing posts with label CCGT. Show all posts

2014/01/12

UK National grid - Rate of Change of Power

One of the many (usually spurious) reasons people give for not installing wind power is that the grid will have to run warm start and spinning reserve (see http://climateandstuff.blogspot.co.uk/2011/05/national-grids-reserves.html ) to cover the sudden loss of wind power.
This power generation is expensive.

The website http://www.gridwatch.templar.co.uk/ connects to a download of national grid status at 5 minute intervals.

I have analysed the data - calculating the slope of power over 3 adjacent data points (15 minute interval) for each available data point. If any of the three data points is zero then no data is plotted.

There are some oddities these have been plotted but the point is allowed off scale to keep valid data to be on a sensible scale:

The plot colour indicates a different vertical scale. (scales have been corrected)


15 days of service

Over 2 days this looks like:
2 days of service

It looks as if wind can vary by as much as 15MW / minute
But this compares with demand which can vary by 170MW/minute

Closing in on a few hours shows:
6 hours - Coal replaces Nuclear

It is interesting to note that at 17 hours 10 minutes it appears as if wind is used for balancing - all fast reaction generators and wind show a drop.

It is also significant that there is little impact of wind variation showing on the fast reactor generators.

Finally Wind output shown over the same few hours:
Wind power output added


2013/12/18

Update on fast start Combine Cycle Gas Turbines (base load suitable for wind backup)

Latest from GE

FlexEfficiency* 50 Combined Cycle Power Plant

"GE's new FlexEfficiency* 50 Combined Cycle Power Plant is an innovative total plant design that defines a new standard for high efficiency and operational flexibility. The FlexEfficiency 50 uses an integrated approach to reduce fuel costs, create additional revenue sources, improve dispatch capability and reduce carbon emissions compared to prior technologies. With new gas turbine, steam turbine, and generator components—along with digital control capabilities, power island integration, and a turnkey plant design—the new 510 MW block-size plant features an expected baseload efficiency of more than 61 percent."
http://www.ge-energy.com/products_and_services/products/gas_turbines_heavy_duty/flexefficiency_50_combined_cycle_power_plant.jsp


60% efficiency down to 87 percent load
Greater than 50 MW/minute while maintaining emissions guarantees
40 percent turndown within emissions guarantees
One button push start in under 30 minutes
Total Plant Design
  • High start reliability with simplified digital controls
  • Plant-level flexibility and maintainability
  • Two-year construction schedule
Leading Baseload Efficiency
  • More than 61 percent baseload efficiency
  • Integrated Solar Combined Cycle (ISCC) greater than 70 percent baseload efficiency
Low Life-Cycle Costs
  • Designed for twice the starts and hours capability compared to current GE technologies
original posting: http://climateandstuff.blogspot.co.uk/2011/05/efficiency-of-power-plant-operating.html

2012/05/20

Wind and the price of electricity in UK

From a post at wuwt  (EU violates Aarhus Convention in ‘20% renewable energy by 2020’ program) :

Mark Duchamp, Executive Director of EPAW, points that Mr. Swords initiated his recourse one and a half years ago, as it was already obvious that the European Commission was imposing an enormously costly and ineffective policy to EU Members States without properly investigating the pros and cons. “It is high time that Brussels be held accountable for the hundreds of billions that have been squandered without a reality check on policy effectiveness” says Mark. “To spend so much money, a positive has to be proven. – It hasn’t.”
He [Pat Swords] continues: “Electricity costs are soaring to implement these dysfunctional policies, which have by-passed proper and legally-required technical, economic and environmental assessments. Not only is the landscape being scarred as thousands of wind farms are being installed, but people in the vicinity are suffering health impacts from low frequency noise, while birdlife and other wildlife is also adversely impacted. It is long overdue that a STOP was put to this type of illegal and dysfunctional policy development and project planning.”

So just how has windpower affected the UK electricity prices. Presumably if Swords is correct then the price of electricity will have increased at a greater rate than the fuel used to generate it. With words like "soaring" used these differences must be substantial.

Looking at data from http://www.decc.gov.uk/assets/decc/statistics/source/prices/qep213.xls you get this graph.


Interesting! Less of a soaring price than gas or coal
So is this just another distortion from the watts crowd?

If windpower were a driving factor then perhaps the energy cost will appear as a bigger budget item in the countries with higher windpower generation.
So let's have a look at germany:
compared to UK
compared to Denmark

So with UK having the lowest penetration of windpower of the three it also has the biggest Utilities cost (this of course includes a number of utilities not just electricity.


How about Cradle to grave costs. Here is the build / working breakdown of costs over 20 years:
Project: Single wind turbine (800kw)
Location: Balloo Wood, Bangor, Co. Down, Northern Ireland
Turbine: 800kw Enercon E48
Dimensions: 56m hub height, 24m blade length, 80m overall height
NGR: 350760E 379503N (lat 54.6411N, long 5.6656W)
Status: Operational


build £        889,650.00 install
planning etc £        434,583.00 install
maintenance0.0055perkwh
maintenance/year for delivered 280kwh £             562.49 per year
routine expenses £         30,000.00 per year
rating1000kwh
load factor28%
deliverd energy280kwh
Balancing Cost £               0.014 per kWh
Short term Reserve £               0.007 per kWh
total install cost= £     1,324,233.00
install cost/delivered kwh £           4,729.40
conventional backup costs/year £         51,544.08 per 280 kWh/year
running cost/year £         82,106.57 per 280 kWh/year
over n years25
total install over 25 yrs £     1,324,233.00
running cost over 25 yrs £     2,052,664.13
total cost over 25 yrs £     3,376,897.13
decomissioning cost (guess=.5*build) £        444,825.00
total cradle to grave cost £     3,821,722.13
energy generated over 25 yrs61362000kWh
cost per kwh over 25 yrs £               0.062 per kWh


most data from
http://silverford.com/blog/?p=1689/
This seems a reasonable figure but the decommissioning costs are pure guess work. The life time of most wind turbines is believed to be 25 years. The warranty period is 12years for this turbine.

A closer look at Germany/france:
For example:

Germany 2012 Note price Note Double peak

Germany 2012 Note price note single peak at peak volume

 PV electricity produced in Germany
check PV produced on Germany on daily basis from 2010


How about nuclear??


2011/05/03

Efficiency of power plant operating below capacity, start up times etc.

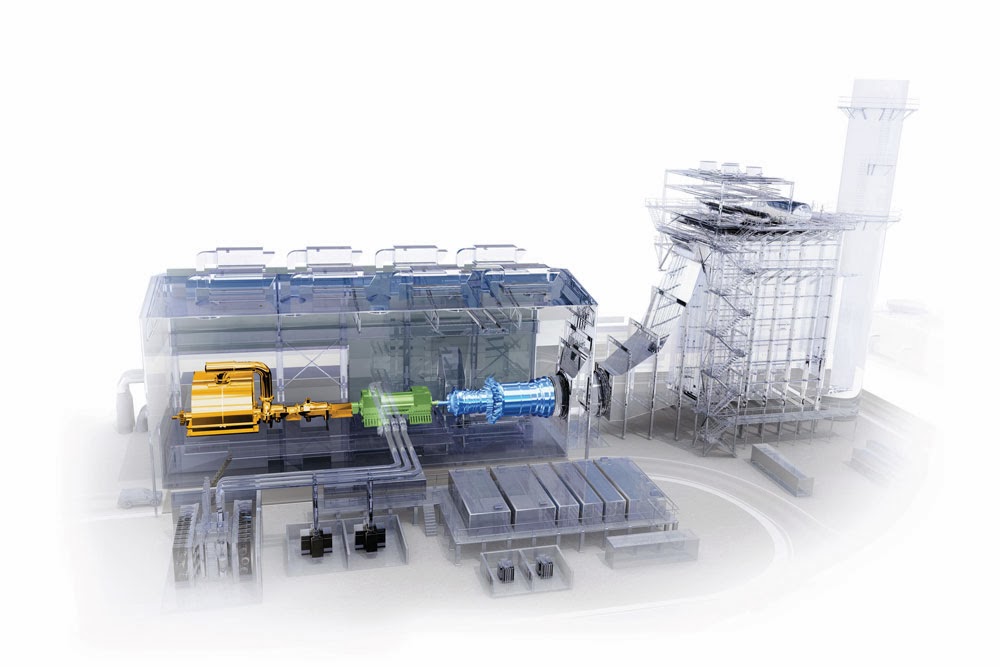
First a combined cycle gas turbine - not known for its efficiency at less than 100% of rated output.

http://www.gepower.com/prod_serv/products/tech_docs/en/downloads/ger3574g.pdf
Fast starting and loading is characteristic of STAG combined-cycle generation systems. This enables them to operate in mid-range, with daily start peaking service as well as baseload.

Typically, STAG systems can achieve full load within one hour during a hot start and within approximately three hours for a cold start.

Multi-shaft STAG systems allow the gas turbines to start independently of the steam cycle and provide about 65% of the plant capability within 15–25 minutes, depending on the size of the gas turbine, for hot, warm, and cold starts, as illustrated in Figure 36.Single-shaft STAG systems are started and loaded to full capacity in about the same time period as the multi-shaft STAG systems. The startup sequence and load profile for the single-shaft systems differ because the gas and steam turbines are started as a single integrated unit and not as two separate units. Single-shaft STAG startup is illustrated in Figure 37.


Now one designed for variable output

http://www.gepower.com/prod_serv/products/aero_turbines/en/downloads/lms100_brochure.pdf
The LMS100 is the Right Solution:
Outstanding full- and part-power efficiency
Low hot-day lapse rate
High availability – aero modular maintenance
Low maintenance cost
Designed for cycling applications
No cost penalty for starts and stops
Load-following capability
10 Minutes to full power
Improves average efficiency in cycling
Potential for spinning reserve credits
Reduced start-up emissions
Synchronous condenser capability


From the House Of Lords.

http://www.parliament.the-stationery-office.co.uk/pa/ld200708/ldselect/ldeconaf/195/19507.htm

101. The first cost imposed by intermittency is that more plant has to be held in reserve to cope with short-term fluctuations in output. At present, National Grid, which operates the electricity system,[34] keeps a number of power stations running at less than their full capacity, providing about 1 GW of spinning reserve—that is capacity which can automatically respond to any shortfall in generation within seconds (Q 293).[35] The company also contracts with other stations to start generation quickly and has arrangements with industrial consumers to reduce their demand at short notice, in order to restore the level of spinning reserves as soon as possible after they are used. The company holds about 2.5 GW of this standing reserve (Q 293); 70% of this comes from generation, and 30% from industrial consumers (p 144).

102. As the amount of wind generation rises, the potential short-term change in wind output will also increase, and National Grid will have to hold more reserve to cope with this increase. The company told us that if renewables provided 40% of electricity generation—the share the company believes would be needed to meet the EU's 2020 energy target—its total short-term reserve requirements would jump to between 7 and 10 GW. Most of this would be standing rather than spinning reserves. This would add £500 million to £1 billion to the annual cost of these reserves—known as balancing costs—which are now around £300 million a year (Q 293). This is equivalent to around 0.3 to 0.7 pence per kWh of renewable output.

103. Estimates of balancing costs vary widely. The government has commissioned research from the consultancy SKM,[36] which estimated that if renewables provided 34% of electricity by 2020, with 27.1% from wind power, the extra cost of short-term balancing would be about 1.4 p/kWh of wind output[37] (Q 481). This equates to a total cost of £1.4 billion, well above that assumed by National Grid. Several pieces of evidence cited a 2006 report by the UK Energy Research Centre (UKERC),[38] which had estimated the balancing costs with up to 20% of intermittent renewable output in Great Britain at 0.2-0.3 pence per kWh. Although the share of renewables in the SKM study was less than double that of UKERC, the balancing costs per unit were more than five times higher. In part, this may reflect higher fuel costs since the studies surveyed by UKERC were performed; but it will also reflect the greater challenges of dealing with larger shares of intermittent renewable generation.

So the costs of up to 20% wind is between £0.002 and £0.014 per kWh

The UK cost per kWh is approx £0.11

added 2011-11-24