A post at wuwt data fudging / incompetence:
Problematic Adjustments And Divergences (Now Includes June Data)
Rgbatduke June 10, 2015 at 5:52 am [the full entry]
The two data sets should not be diverging, period, unless everything we
understand about atmospheric thermal dynamics is wrong. That is, I will add my
“opinion” to Werner’s and point out that it is based on simple atmospheric
physics taught in any relevant textbook.
This does not mean that they cannot and are not systematically differing; it
just means that the growing difference is strong evidence of bias in the
computation of the surface record. This bias is not really surprising, given
that every new version of HadCRUT and GISS has had the overall effect of cooling
the past and/or warming the present! This is as unlikely as flipping a coin (at
this point) ten or twelve times each, and having it come up heads every time
for both products. In fact, if one formulates the null hypothesis “the global
surface temperature anomaly corrections are unbiased”, the p-value of this
hypothesis is less than 0.01, let alone 0.05. If one considers both of the major
products collectively, it is less than 0.001. IMO, there is absolutely no
question that GISS and HadCRUT, at least, are at this point hopelessly
corrupted.
One way in which they are corrupted with the well-known Urban Heat Island
effect, wherein urban data or data from poorly sited weather stations
shows local warming that does not accurately reflect the spatial average surface
temperature in the surrounding countryside. This effect is substantial, and
clearly visible if you visit e.g. Weather Underground and look at the
temperature distributions from personal weather stations in an area that
includes both in-town and rural PWSs. The city temperatures (and sometimes a few
isolated PWSs) show a consistent temperature 1 to 2 C higher than the
surrounding country temperatures. Airport temperatures often have this problem
as well, as the temperatures they report come from stations that are
deliberately sited right next to large asphalt runways, as they
are primarily used by pilots and air traffic controllers to help planes land
safely, and only secondarily are the temperatures they report almost invariably
used as “the official temperature” of their location. Anthony has done a fair
bit of systematic work on this, and it is a serious problem corrupting all of
the major ground surface temperature anomalies.
The problem with the UHI is that it continues to systematically increase
independent of what the climate is doing. Urban centers continue to grow, more
shopping centers continue to be built, more roadway is laid down, more vehicle
exhaust and household furnace exhaust and water vapor from watering lawns bumps
greenhouse gases in a poorly-mixed blanket over the city and suburbs proper, and
their perimeter extends, increasing the distance between the poorly sited
official weather stations and the nearest actual unbiased countryside.
HadCRUT does not correct in any way for UHI. If it did, the correction would
be the more or less uniform subtraction of a trend proportional to global
population across the entire data set. This correction, of course, would be a
cooling correction, not a warming correction, and while it is impossible to tell
how large it is without working through the unknown details of how HadCRUT is
computed and from what data (and without using e.g. the PWS field to build a
topological correction field, as UHI corrupts even well-sited official stations
compared to the lower troposphere temperatures that are a much better estimator
of the true areal average) IMO it would knock at least 0.3 C off of 2015
relative to 1850, and would knock off around 0.1 C off of 2015 relative to 1980
(as the number of corrupted stations and the magnitude of the error is not
linear — it is heavily loaded in the recent past as population increases
exponentially and global wealth reflected in “urbanization” has outpaced the
population).
GISS is even worse. They do correct for UHI, but somehow, after they got
through with UHI the correction ended up being neutral to negative. That’s
right, UHI, which is the urban heat island effect, something that has
to strictly cool present temperatures relative to past ones in unbiased
estimation of global temperatures ended up warming them instead. Learning that
left me speechless, and in awe of the team that did it. I want them to do my
taxes for me. I’ll end up with the government owing me money.
However, in
science, this leaves both GISS and HadCRUT (and any of the other temperature
estimates that play similar games) with a serious, serious problem. Sure, they
can get headlines out of rewriting the present and erasing the hiatus/pause.
They might please their political masters and allow them to convince a skeptical
(and sensible!) public that we need to spend hundreds of billions of dollars a
year to unilaterally eliminate the emission of carbon dioxide, escalating to a
trillion a year, sustained, if we decide that we have to “help” the rest of the
world do the same. They might get the warm fuzzies themselves from the belief
that their scientific mendacity serves the higher purpose of “saving the
planet”. But science itself is indifferent to their human wishes or needs! A
continuing divergence between any major temperature index and RSS/UAH is
inconceivable and simple proof that the major temperature indices are
corrupt.
Right now, to be frank, the divergence is already large enough to be raising
eyebrows, and is concealed only by the fact that RSS/UAH only have a 35+ year
base. If the owners of HadCRUT and GISSTEMP had the sense god gave a goose,
they’d be working feverishly to cool the present to better match the satellites,
not warm it and increase the already growing divergence because no atmospheric
physicist is going to buy a systematic divergence between the two, as Werner has
pointed out, given that both are necessarily linked by the Adiabatic Lapse Rate
which is both well understood and directly measurable and measured (via e.g.
weather balloon soundings) more than often enough to validate that it accurately
links surface temperatures and lower troposphere temperatures in a predictable
way. The lapse rate is (on average) 6.5 C/km. Lower Troposphere temperatures
from e.g. RSS sample predominantly the layer of atmosphere centered roughly 1.5
km above the ground, and by their nature smooth over both height and surrounding
area (that is, they don’t measure temperatures at points, they directly measure
a volume averaged temperature above an area on the surface. They by their nature
give the correct weight to the local warming above urban areas in the actual
global anomaly, and really should also be corrected to estimate the CO_2
linked warming, or rather the latter should be estimated only from unbiased
rural areas or better yet, completely unpopulated areas like the Sahara desert
(where it isn’t likely to be mixed with much confounding water vapor
feedback).
RSS and UAH are directly and regularly confirmed by balloon soundings and,
over time, each other. They are not unconstrained or unchecked. They are
generally accepted as accurate representations of LTT’s (and the atmospheric
temperature profile in general).
The question remains as to how
accurate/precise they are. RSS uses a sophisticated Monte Carlo process to
assess error bounds, and eyeballing it suggests that it is likely to be accurate
to 0.1-0.2 C month to month (similar to error claims for HadCRUT4) but much more
accurate than this when smoothed over months or years to estimate a trend as the
error is generally expected to be unbiased. Again this ought to be true for
HadCRUT4, but all this ends up meaning is that a trend difference is a serious
problem in the consistency of the two estimators given that they must be linked
by the ALR and the precision is adequate even month by month to make it well
over 95% certain that they are not, not monthly and not on average.
If they grow any more, I would predict that the current mutter about the
anomaly between the anomalies will grow to an absolute roar, and will not go
away until the anomaly anomaly is resolved. The resolution process — if the gods
are good to us — will involve a serious appraisal of the actual series of
“corrections” to HadCRUT and GISSTEMP, reveal to the public eye that they have
somehow always been warming ones, reveal the fact that UHI is ignored or
computed to be negative, and with any luck find definitive evidence
of specific thumbs placed on these important scales. HadCRUT5 might — just might
— end up being corrected down by the ~0.3 C that has probably been added to it
or erroneously computed in it over time.
rgb
==========================================
What I would like RGB to answer is:
He is basically stating that all major providers of temperature series of either
1 being incompetent
2 purposefully changing the data to match their belief.
IF 1. How can so many intelligent educated people be so incompetent. This seems very unlikely. Have he approached the scientists concerned and shown them where they are in error. If not, Why not?
IF 2. This is a serious accusation of scientific fraud. As such have he approached any of the scientists involved and asked for an explanation? If not, why not? he is part of the same scientific community.
Can he give reasons why he thinks scientists over the whole globe would all be party to the same fraud. Do climate scientists live in luxury mansions taking expensive family holidays - perhaps he could provide proof?. What manages to keep so many scientists in line - are there families/careers/lives threated to maintain the silence. why is there no Julian Assange or Edward Snowden, willing to expose them?
2015/07/26
Lightning Photos
Best storm for decades (that I have seen) - about 4 hours of rapid strikes from midnight on 3rd July 2015 near Great Yarmouth


| 1st strike after forks |


1st strike after forks coloured green
All pictures taken using same zoom from a video
2015/04/25
The Annual Nenana Ice Classic is Over for Another Year
After an initial movement 2 days ago an ice-jam prevented full movement of the tripod and the clock was not stopped. However, the Tanana River officially broke up on April 24th at 2:25 P.M. Alaska Standard Time.
http://www.nenanaakiceclassic.com/
Tripod moved but not moving

Not free of ice but no more tripod:

So how does this extended date fit in with previous data.
2 plots
one timed from start of year

this one timed from vernal equinox

Seems to be following a declining period with a few early peaks
http://www.nenanaakiceclassic.com/
Tripod moved but not moving

Not free of ice but no more tripod:

So how does this extended date fit in with previous data.
2 plots
one timed from start of year

this one timed from vernal equinox

Seems to be following a declining period with a few early peaks
2015/03/27
WUWT Claim: NOAA demands $262,000 fee for looking at their ‘public’ data - more stretching of the truth!
WUWT article title:
Outrageous: NOAA demands $262,000 fee for looking at their ‘public’ data
Anthony Watts / 1 hour ago March 27, 2015
Eric Worrall writes: It looks like NOAA have found a new way to stifle FOIA inquiries from the public. According to Steve Goddard, NOAA have just demanded a $262,000 administrative fee for zipping up a few raw data files.
-----------------------
I think most would agree this is totally over the top pricing. A few old data files a few programmes - a few seconds work.
BUT
What had they asked for?
Well this is from the NOAA response:
So seems like more than a few data files.
From Goddards blog it seems that this is what is asked for:
kentclizbe says:
 http://www.archives.gov/preservation/technical/imaging-storage-appendix.html#eleven
Outrageous: NOAA demands $262,000 fee for looking at their ‘public’ data
Anthony Watts / 1 hour ago March 27, 2015
Eric Worrall writes: It looks like NOAA have found a new way to stifle FOIA inquiries from the public. According to Steve Goddard, NOAA have just demanded a $262,000 administrative fee for zipping up a few raw data files.
-----------------------
I think most would agree this is totally over the top pricing. A few old data files a few programmes - a few seconds work.
BUT
What had they asked for?
Well this is from the NOAA response:
The National Environmental Information Center (which includes the former National Climatic Data Center) has access to a subset of the requested records. Very few if any letters, phone logs, memos, and other communications on this subject would be available. Historical internal and external emails are archived, though they are expensive to access and analyze due to unsupported technology.
As data stewardship – including homogeneity adjustments – has been central to NCDC’s mission for decades, determining which records are responsive to this extremely broad request will require significant resources. Responding to this part of the request would require retrieving, reviewing, and packaging many tens of thousands of items in at least 29 years of communications, if they can be located.
For investigating availability of items and code, some from obsolescent systems, evaluating content, and screening for non-responsive, deliberative, or personally identifying information, I estimate the following Federal-equivalent labor classes, durations and costs. The actual personnel, and sources of labor (Federal or contracted), would depend on conditions and workforce options available at the specific project start time.
So seems like more than a few data files.
From Goddards blog it seems that this is what is asked for:
kentclizbe says:
JN,
Please provide the complete source code used for processing raw US temperature data.
This message is to confirm your request submission to the FOIAonline application: View Request. Request information is as follows:
• Tracking Number: DOC-NOAA-2014-001602
• Requester Name: Kent Clizbe
• Date Submitted: 09/07/2014
• Request Status: Submitted
• Description: 1. Temperature Data Record Adjustments: Rationale, Methodology, Discussions–USG employees and others
For the NOAA/National Climactic Data Center: Please provide Internal and external e-mails, letters, phone logs, memos, and other communications, from, to, and between: government employees, external consultants, experts, advisors, or other parties regarding the rationale, methodology, and other issues concerning adjustments/homogenization or other changes to both the US and global temperature record data, from the beginning of the adjustments through today.
2. Temperature Data Computer Code Used to Process/Adjust/Homogenize US Temperature DataPlease provide the complete source code used for processing raw US temperature data.
Everything except the toilet paper again . see http://climateandstuff.blogspot.co.uk/2011/06/schnare-vs-uva-impossible-request.html for something similar.
Do they think that this is easy to obtain?
You cannot just zip emails and send since there may be personal information included.
You have to employ people to read and approve and redact addresses.
Then of course there is the problem of changing technology - from NOAA comments email backups are available but not in a format currently readable. - so find the hardware - write an interface - sort through the myriad of emails that dot do not contain private comms. This is not simple search and zip as Goddard suggests.
As an example WUWT carried an article about retrieving photos from 1960s NASA missions:
A message from Dennis Wingo:
The Lunar Orbiter Image Recovery Project (LOIRP), is a NASA ESMD funded project to recover the original Lunar Orbiter analog data which was recorded on an Ampex FR-900 2″ video instrumentation recorder. As far as we know, we have the last surviving drives of this type in the world. We have retired Ampex engineers working with us on this project but the FR-900 was a limited use machine (exclusively the U.S. government at the FAA, USAF, NASA).
What we need is to find any possible source of documentation (we know about the Stanford Archive and have been there many times) for the FR-900 or the possibility of actual machines...
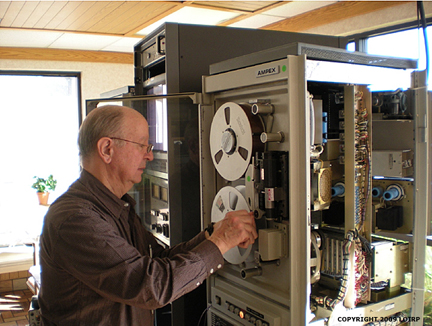
This is what one section of NOAA were using in the 80s/90s.
Would they be backing up things like emails when data storage was so expensive? Would they be transferring irrelevant data like emails to new storage media?
Would they still have those tape drives/optical drives (not CDs but 12" disks)?
Date System Installed: NOAA's satellite data processing and storage system became operational in September 1990.
System Installed by: Integrator/Vendor.
NOAA's data storage system components include:
- Digital Equipment Corporation (DEC) VAX 8530 computer system with 96 MB memory and floating point accelerator, 4 VUP (speed).
- VAX 11-785 computer system with 64 MB of memory and floating point accelerator, 1.7 VUP (speed).
- VAX 6000-510 computer system with 128 MB of memory and floating point accelerator, 13 VUP (speed).
- Data communications network including Star Coupler configuration and Ethernet (Ethernet Server-16 ports); router to Internet, NASA, DAMUS, and NOAA backbone.
- User workstations consisting of 48 PCs.
- Multiple banks of magnetic hard disks, 9-track magnetic tape (800, 1600, 6250 bpi) drives, square tape (240 MB), and tape cartridge drives (5.2 GB and 2.3 GB).
- Sony optical disk jukebox; 50 disk capacity (50 x 6.0 GB disks).
- Technical system documentation, UPS power supply, and on-site systems maintenance staff.
2015/01/21
Levelised Cost Of Energy

Wind vs Time

PV vs time

Coal and gas vs time

It seems that coal and gas are rising with time whilst renewable are falling.
From these figures it appears that wind is now generating at a cost similar to coal and gas without carbon capture and storage.
Data from World Energy Perspective Cost of Energy Technologies
Published by World Energy Council in 2013
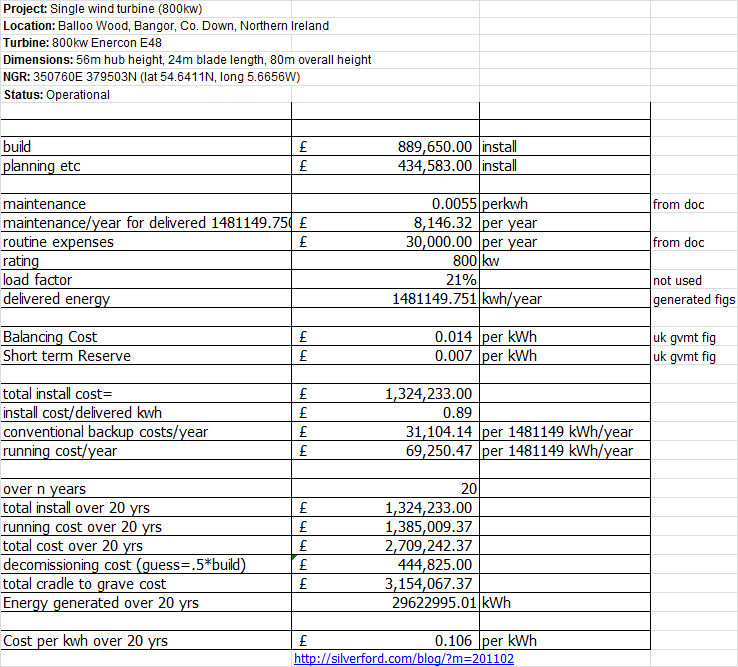
The only data on wind turbine build and running cost I have found is here
https://www.whatdotheyknow.com/request/balloo_wood_wind_turbine
2015/01/08
Satellite Temperatures
A post from Spencer:
climateandstuff.blogspot.co.uk/2012/06/further-thoughts-on-co2-cycle.html
(repeat post as 1st got trashed.
This linked to a post on this blog with the following plot:

O2 is not constant over a year and continually falls over the period shown (it's locked to co2 cycle!). If Spencer believes O2 is constant then perhaps this is a source of error in his UAH measurements!!
Additional info on oxygen plot:
http://bluemoon.ucsd.edu/publications/ralph/Keeling_et_al_Tellus_07.pdf
The primary O2/N2 reference gases (or ‘primaries’) used at Scripps consist of 12 tanks filled between 1986 and 1989, and an additional set of six filled between 1993 and 1994, as summarized
in .....
The large size of the atmospheric O2 reservoir makes measurements of the relatively small changes in O2 concentration challenging. Resolving a land biotic sink of 2 Pg C requires the
ability to detect a change of ∼1.8 × 10¹⁴ moles in the global O2 abundance, which corresponds to 0.000 49% of the total burden of O2 in the atmosphere. Changes in O2 concentration are
typically expressed in terms of the relative change in O2/N2 ratio δ(O2/N2) = (O2/N2)sample/ O2/N2)reference − 1, where δ(O2/N2) is multiplied by 10e6 and expressed in ‘per meg’ units. In these units, a change of 1.8×10e14 moles in the globalO2 abundance corresponds to a change of 4.9 per meg. In spite of the measurement challenge, there are now at least six independent
O2 measurement techniques in use that have demonstrated a precision at the level 6 per meg or better (Keeling, 1988a; Bender et al., 1994; Manning et al., 1999; Tohjima, 2000; Stephens et al., 2003; Stephens et al., 2006), and these methods are being variously applied for flask or in situ measurements by at least 12 scientific institutions.
Why Do Different Satellite Datasets Produce Different Global Temperature Trends?
January 6th, 2015 by Roy W. Spencer, Ph. D.
I thought it would be useful to again outline the basic reasons why different satellite global temperature datasets (say, UAH and RSS) produce somewhat different temperature trends.
They all stem from the fact that there is not a single satellite which has been operating continuously, in a stable orbit, measuring a constant layer of the atmosphere, at the same local time every day, with no instrumental calibration drifts.
Instead, what we have is multiple satellites (we use 14 of them for the UAH processing) with relatively short lifetimes (2 to 16+ years), most of which have decaying orbits which causes the local time of measurement to slowly change over the years, slightly different layers sampled by the earlier (pre-1998) MSU instruments compared to the later (post-1998) AMSU instruments, and some evidence of small calibration drifts in a few of the instruments.
An additional complication is that subsequent satellites are launched into alternating sun-synchronous orbit times, nominally 1:30 a.m. and p.m., then 7:30 a.m. and p.m., then back to 1:30 a.m. and p.m., etc. Furthermore, as the instruments scan across the Earth, the altitude in the atmosphere that is sampled changes as the Earth incidence angle of view changes.
All of these effects must be accounted for, and there is no demonstrably “best” method to handle any of them. For example, RSS uses a climate model to correct for the changing time of day the observations are made (the so-called diurnal drift problem), while we use an empirical approach. This correction is particularly difficult because it varies with geographic location, time of year, terrain altitude, etc. RSS does not use exactly the same satellites as we do, nor do they use the same formula for computing a lower tropospheric (“LT”) layer temperature from the different view angles of AMSU channel 5.
We have been working hard on producing our new Version 6 dataset, revamping virtually all of the processing steps, and it has taken much longer than expected. We have learned a lot over the years, but with only 2-3 people working part time with very little funding, progress is slow.
In just the last month, we have had what amounts to a paradigm shift on how to analyze the data. We are very hopeful that the resulting dataset will be demonstrably better than our current version. Only time will tell.
----------------------
Basically he is saying that ALL satellite temperature are models with various bodges to correct for satellite inconsistencies.
This generated a post:
David A says:
“So you are saying that all satellite temperatures are models with a few bodges added?”
Of course. The satellites aren’t measuring temperatures, they’re measuring microwaves. It takes a data model to convert those into temperatures…. He’s a description of RSS’s algorithm; it’s quite complex:
“Climate Algorithm Theoretical Basis Document (C-ATBD)”
RSS Version 3.3 MSU/AMSU-A Mean Layer Atmospheric Temperature
http://images.remss.com/papers/msu/MSU_AMSU_C-ATBD.pdf
It’s not clear to me why satellite temperatures are said to be clean and exact while surface measurements are not….
followed by a post from Spencer:
Roy Spencer says:
Franco, not in the case of microwave emission in the 50-60 GHz range, which depends on the concentration of molecular oxygen, which is extremely stable in space and time (unlike CO2).
I then tried to post a comment only to find I have seemingly been banned:
CO2 and O2 are linked as one would expect so O2 is not constant see the post hereThey all stem from the fact that there is not a single satellite which has been operating continuously, in a stable orbit, measuring a constant layer of the atmosphere, at the same local time every day, with no instrumental calibration drifts.
Instead, what we have is multiple satellites (we use 14 of them for the UAH processing) with relatively short lifetimes (2 to 16+ years), most of which have decaying orbits which causes the local time of measurement to slowly change over the years, slightly different layers sampled by the earlier (pre-1998) MSU instruments compared to the later (post-1998) AMSU instruments, and some evidence of small calibration drifts in a few of the instruments.
An additional complication is that subsequent satellites are launched into alternating sun-synchronous orbit times, nominally 1:30 a.m. and p.m., then 7:30 a.m. and p.m., then back to 1:30 a.m. and p.m., etc. Furthermore, as the instruments scan across the Earth, the altitude in the atmosphere that is sampled changes as the Earth incidence angle of view changes.
All of these effects must be accounted for, and there is no demonstrably “best” method to handle any of them. For example, RSS uses a climate model to correct for the changing time of day the observations are made (the so-called diurnal drift problem), while we use an empirical approach. This correction is particularly difficult because it varies with geographic location, time of year, terrain altitude, etc. RSS does not use exactly the same satellites as we do, nor do they use the same formula for computing a lower tropospheric (“LT”) layer temperature from the different view angles of AMSU channel 5.
We have been working hard on producing our new Version 6 dataset, revamping virtually all of the processing steps, and it has taken much longer than expected. We have learned a lot over the years, but with only 2-3 people working part time with very little funding, progress is slow.
In just the last month, we have had what amounts to a paradigm shift on how to analyze the data. We are very hopeful that the resulting dataset will be demonstrably better than our current version. Only time will tell.
----------------------
Basically he is saying that ALL satellite temperature are models with various bodges to correct for satellite inconsistencies.
This generated a post:
David A says:
“So you are saying that all satellite temperatures are models with a few bodges added?”
Of course. The satellites aren’t measuring temperatures, they’re measuring microwaves. It takes a data model to convert those into temperatures…. He’s a description of RSS’s algorithm; it’s quite complex:
“Climate Algorithm Theoretical Basis Document (C-ATBD)”
RSS Version 3.3 MSU/AMSU-A Mean Layer Atmospheric Temperature
http://images.remss.com/papers/msu/MSU_AMSU_C-ATBD.pdf
It’s not clear to me why satellite temperatures are said to be clean and exact while surface measurements are not….
followed by a post from Spencer:
Roy Spencer says:
Franco, not in the case of microwave emission in the 50-60 GHz range, which depends on the concentration of molecular oxygen, which is extremely stable in space and time (unlike CO2).
I then tried to post a comment only to find I have seemingly been banned:
climateandstuff.blogspot.co.uk/2012/06/further-thoughts-on-co2-cycle.html
(repeat post as 1st got trashed.
This linked to a post on this blog with the following plot:
O2 is not constant over a year and continually falls over the period shown (it's locked to co2 cycle!). If Spencer believes O2 is constant then perhaps this is a source of error in his UAH measurements!!
Additional info on oxygen plot:
http://bluemoon.ucsd.edu/publications/ralph/Keeling_et_al_Tellus_07.pdf
The primary O2/N2 reference gases (or ‘primaries’) used at Scripps consist of 12 tanks filled between 1986 and 1989, and an additional set of six filled between 1993 and 1994, as summarized
in .....
The large size of the atmospheric O2 reservoir makes measurements of the relatively small changes in O2 concentration challenging. Resolving a land biotic sink of 2 Pg C requires the
ability to detect a change of ∼1.8 × 10¹⁴ moles in the global O2 abundance, which corresponds to 0.000 49% of the total burden of O2 in the atmosphere. Changes in O2 concentration are
typically expressed in terms of the relative change in O2/N2 ratio δ(O2/N2) = (O2/N2)sample/ O2/N2)reference − 1, where δ(O2/N2) is multiplied by 10e6 and expressed in ‘per meg’ units. In these units, a change of 1.8×10e14 moles in the globalO2 abundance corresponds to a change of 4.9 per meg. In spite of the measurement challenge, there are now at least six independent
O2 measurement techniques in use that have demonstrated a precision at the level 6 per meg or better (Keeling, 1988a; Bender et al., 1994; Manning et al., 1999; Tohjima, 2000; Stephens et al., 2003; Stephens et al., 2006), and these methods are being variously applied for flask or in situ measurements by at least 12 scientific institutions.
2015/01/04
RSS TLT data from whole monthly record
Using the full monthly data set from RSS lower troposphere temperature (Often truncated to 1996 to latest to show no temperature rise - see wuwt and Monkton).
continental us data when smoothed is same as +-80° global
slope is 0.01°C/year

continental us data when smoothed is same as +-80° global
slope is 0.01°C/year
Subscribe to:
Posts (Atom)


