Many changes have been made to satellite derive temperatures ( I have asked Spencer to explain the differences and unrecorded adjustments on many blogs. BUT never has he bothered to explain).
With the current BEST surface temperature slanging matches raging on the anti AGW blogs all eyes seem to be turning to the satellite record and opinions seem to suggest that these results are what everyone should be usingas the gold standard (mainly because they only show the last 8 year and these have a cooling trend!!)
What goes up must (in earth orbit) eventually come down.
NOAA-15 was once the satellite producing the temperature records (from 1998) however as the hardware progressively fails the data from the AQUA satellite has been used (data available from 2002)
This gave a 6 year overlap where the temperatures could be compared and corrected. This, according to Leif Svalgaard is what happens with the TSI measurements for solar activity.
My complaint is that there is a LARGE error in data between AQUA and NOAA-15 and no attempt to reconcile the differences is made or explanations given.
Indeed The UAH team handling the data seem to adjust data at a whim.
For example: for channel 05 AQUA between the dates of 2010-07-03 and 2011-10-01 data missing in the earlier plot suddenly appeared in the later plot (from 2009-02-01 to 2009-02-03 and on 2010-11-25 and 2010-11-26 Why and how? Also in my data the earlier records were one day adrift !! (could have been me however)
People are quibbling about discrepancies of 0.12 K/decade but looking at the comparison between NOAA-15 data and AQUA this 0.12K/decade is the discrepancies produced by the two satellites and modified by the same team.
Chan 05
.
From the above plot during the overlap period:
NOAA warming is 3.27e-5K/day = 0.119K/decade
AQUA warming is -1.95e-5K/day =
-0.0712K/decade
Also of interest is the two plots for the same series but obtained at different times red and blue in the plot these seem to have been revised without explanation (by up to .08K)
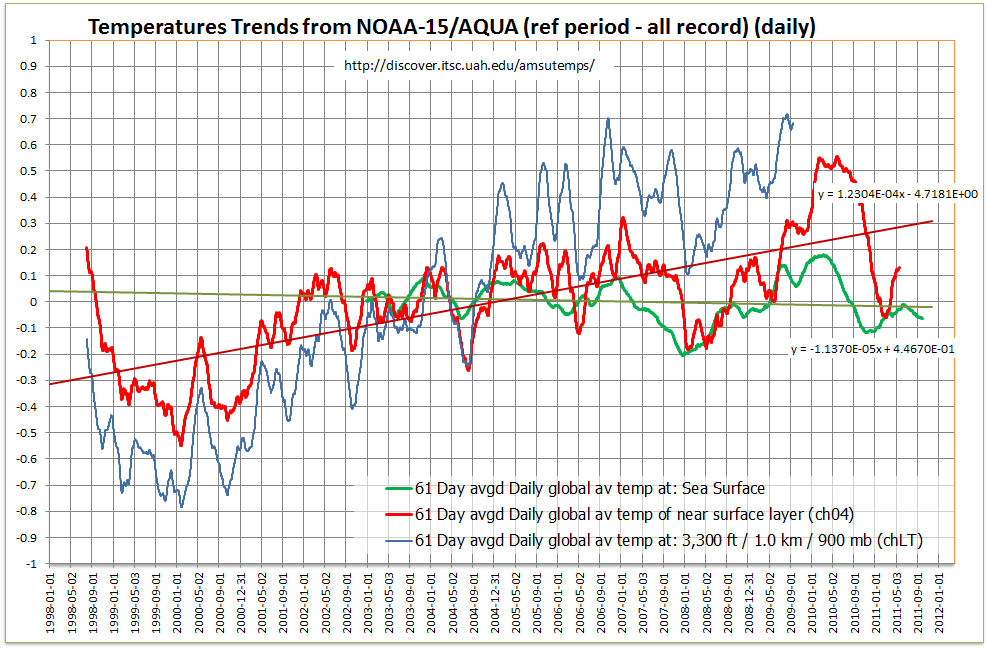
Looking at CH 4 data, the current data on their web site runs from 2002 to 2008 (with the last 6 monts failing) The data that was available (NOAA?) went from 1998 to 2011 and despite this being the longer record is not used on their Discover website.
Again the slope over the valid overlap period is:
AQUA 1.0404e-5K/day = 0.0380K/decade
NOAA 1.1879e-4K/day = 0.434K/decade
Another series CH06
AQUA -4.2323e-5K/day = -0.154K/decade
NOAA -1.7595e-4K/day = -0.642K/decade
Chan 10
AQUA -6.59e-5K/day = -0.2345K/decade
NOAA -9.58e-4K/day = -0.3411K/decade

AQUA -2.1174e-4K/day = -0.754K/decade
NOAA -1.4831e-4K/day = -0.528K/decade
Another plot shows that CHLT (NOAA defunct) and CH04 (recently AQUA defunct) had peaks and troughs occurring at the same time. However comparing CH04 to Sea Surface temperature the temperature of the sea changes BEFORE the air temperature by a couple of months. HOW?
Absolute temperature differences
(
CH4 NOAA) - (CH4 AQUA)=-2K
(
CH5 NOAA) - (CH5 AQUA)=-0.11K
(
CH6 NOAA) - (CH6 AQUA)=-0.99K
(
CH10 NOAA) - (CH10 AQUA)=-0.279K
(
CH13 NOAA) - (CH13 AQUA)=0.062K
Conclusion
There seems to be many more problems with satellite temperatures than with surface temperatures. Why then are these held up as being the golden standard???