Showing posts with label fft. Show all posts

2012/07/02

Arctic Ice (update)

Latest plots - accurate to 1st July 2012 - of sea ice extent. The 1st july slope is unchanged from previous years.

Extent is below whole record average but similar to 2007


A few plots of FFTs from JAXA data for Arctic Sea Ice extent data - only 10 years of data so FFT info is unreliable for periods of around a couple of years or more.
Data is daily (with a few infills).
I see no 28 day lunar events:

There are periods of:
61 days
73 days
124 days
186 days
1 year
652 day (possibly)
2 weeks (possibly)


2012/06/22

Yet More FFT Stuff

Using a variable bandwidth filter (constant % of frequency) and scanning it from low to high frequency should be able to pull any repetitive signals out of noise. I used this in getting a reconstructed HADCRUT3 waveform out of the sum of cosines.

http://climateandstuff.blogspot.co.uk/2011/05/is-it-trend.html


But just how well does it compare to a FFT of the same data.


FFT plot from spice programme (Blackmann-Harris window)

The bandpass plot is based on 4000 points and the FFT on 4096.
All 5 frequencies were found in both Band pass and FFT forms.The FFTs show correct amplitudes but the filtering shows a drop off with frequency

Next a comparison on hadcrut4 NH data 1850 to 2011 data length 1930 months


The interpretation of the band pass filtered for is easier but is it more reliable? The reported frequency needs an offset adjustment

This test at least proves that the bandpass plugin works!

Bandpass plugin is available from Web:reg:
http://www.web-reg.de/bp_addin.html

Spice programme:
http://www.linear.com/designtools/software/#LTspice


This site has other useful goodies!

2012/06/16

About FFTs - you cannot change the laws of physics

On the use of FFTs to pick out periods:
EXCEL has a maximum count of 4096 points
Other programmes will be different.

Taking EXCEL’s case and monthly time intervals will give you a total of 341 years of data – just about 20 years less than the full CET record Enough you may say to determine any 100 year or less cycles.
However these are the yearly data points above 50 years – you will get no resolution better than these from EXCEL. 341.33 , 170.67, 113.78, 85.33, 68.27, 56.89, 48.76, 42.67

Really not very good above 50 years.
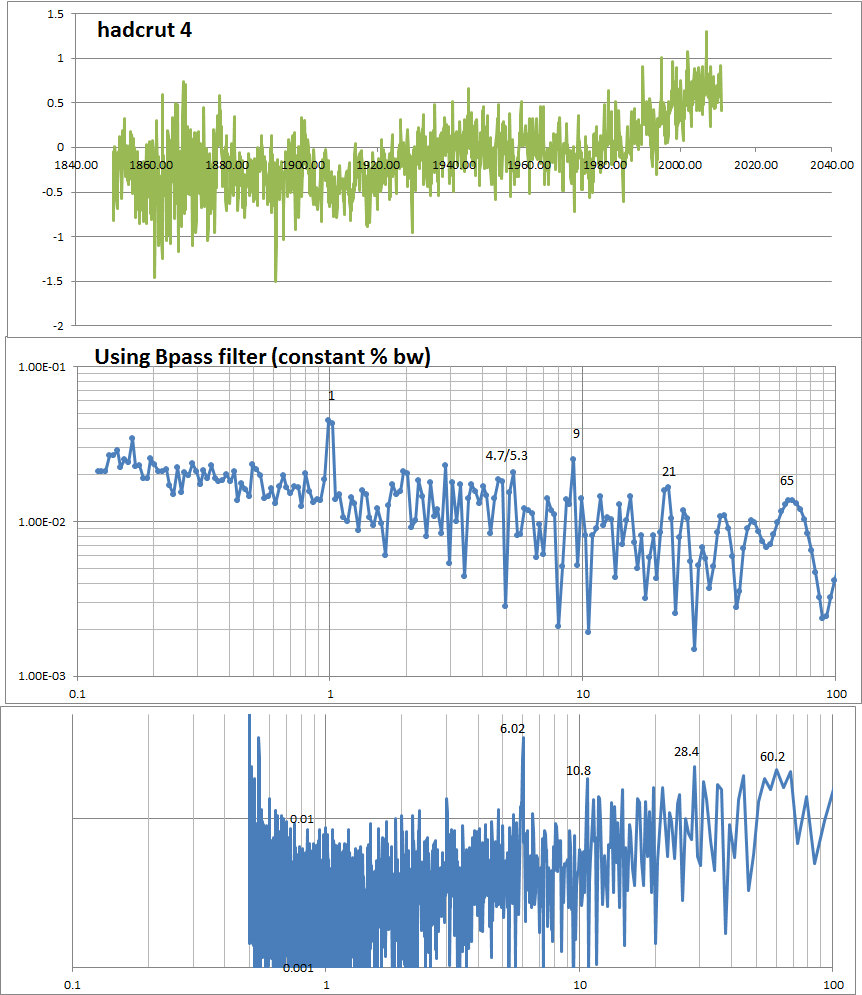
Here are a couple of plots showing the problem:

Note you loose te 65 and 80 year periods into one hump


Add a bit of separation and 2 peaks are produce but at periods of 57 and 85 years not 55 and 90 - you only get output at resolved points listed above.

Most people show their plots with wonderfully rounded curves:
This contains no data extra but the rounding makes it look as if there is more data than before.

Here's some indication of the extraction of data from a noisy signal - first the signal,
3 equal amplitude sine waves added


Next add in some noise


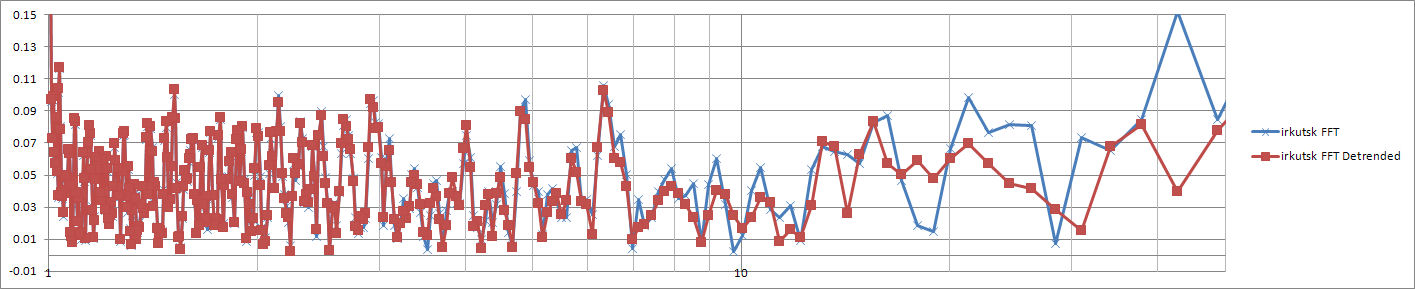
Next use EXCELs built in FFT


And the 3 sine waves become visible (Just) Note that the 90 year signal is much attenuated.


So what about using a different programme for the FFT. Using the same 4096 points from the EXCEL programme and inputting these to a SPICE analysis gives the following un-windowed plot (note the x axis is in 1/year)


Because all FFT generation is looking at a window of the data then any data that has a discontinuity at beginning and end will cause invalid FFTs. The spice programme has a number of available windowing functions to lessen this effect. The plot below shows the effect of a Hamming filter used on the data. Note that the level to the left has been much reduced. Also note that there is no extra data in these plots compared to the EXCEL plots Also note that the vertical scale is logarithmic EXCEL in the plots above is linear


So now try 1500year sequence of the same frequencies:


A lot more detail but still not good detail in the longer periods.

So just how people use records of less than 300 years and claim periods of 100 years. The data is not  there, there is no way of increasing the resolution. If the data is not there then claiming long period "oscillations" are just incorrect and trying to equate periods of 50+ years to planetary motion is just "silly" - there is insufficient data!!. 

2011/09/19

More on Bart, FFTs and Cloud vs temperature

To me it seems that the plot has been lost on CA were discussions revolve around FFTs iFFT convolutions etc.

Is there a relation ship between cloud (Net_tot-SW_clr) and temperature or temperature and cloud?

How about a few simple plots:

The first uses data filtered with a Hodrick-Prescott filter of 1 and plots temperature anomaly against (Net_tot-SW_clr) sorted .
The second removes any filtering:


As can be seen the is a slight rising trend.

So now reverse the axis and plot cloud cover vs temperature anomaly (sorted) These are Duff!!


So there does seem to be a temperature and  (Net_tot-SW_clr) relationship. But which is the forcing????

2011/09/12

FFTs Cloud feedback and Stuff

Many "sums" have been done using FFTs and convolution.
It started out with Spencer:


Changed to this with "Bart"


However there seems to me to be problems with all of this.

1.  the data being used is from 10 years only
2.  the data from clear to cloudy sky is not simultaneous
3.  the  data is average over 1 month so can never be safely used to subtract clear from cloudy - the data is smeared over 1 month and can never be data from the same region.
3a. Albedo of soil and water are very different- cloud over water will show a large TOA flux difference wheras the cloud over land will show less outward going flux.
water albedo= 0.02 approx (at some angles)

ground albedo = 0.1 to 0.5
Clouds albedo = 0 to 0.8
Wiki
4.  What about the "insulating" effect of clouds at night. Shouldn't this be included in any flux calculations?
5.  There is no way the data available from Spencer/Dessler/Bart can show the accurate change in flux due to clouds

the Plots below are simple spectrums using the FFT function in excel. Note that any thing over 60 years period has very little resolutuion. and these are from 200 year records not 10 year!!.

Also when doing FFT on a non infinite series the trend should be removed before the fft transform is applied as the termination of data at either end causes problems. Using a FFT windowing function will also improve performance.

Comparison between data with a trend and detrended data:


Ocean albedo calc
http://snowdog.larc.nasa.gov/jin/rtset.html

Measurement of ground albedo
http://www.cuepe.ch/html/biblio/pdf/ineichen%201990%20-%20ground-reflected%20radiation%20and%20albedo%20(se).pdf

Variation/validation  of Albedo
http://citeseerx.ist.psu.edu/viewdoc/download?doi=10.1.1.64.6930&rep=rep1&type=pdf