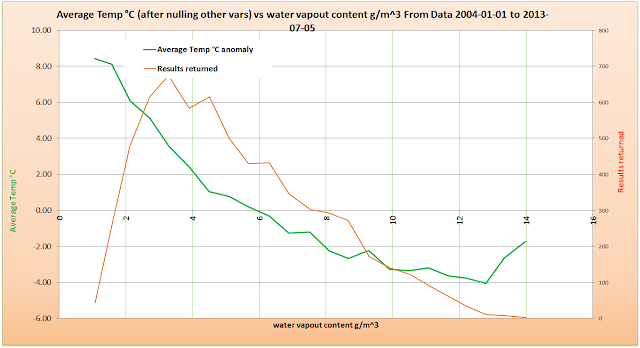
This analysis shows the interdependence of temperature and other data.
Temperature may be the cause or the effect!
The second curve on each plot shows the number of results returned. Obviously the more results the more likely the data returned is valid.
All data is averaged with the top and bottom 30% discarded to remove outliers
Temperature is affected negatively by the absolute humidity (gms h2o/cu m). To heat air and water vapour takes more energy than air alone hence the negative slope.
Using the nulling technique produces a plot with little day of year dependence (no annual peak or dip is obvious).
The slope of the line is =0.0001602 per day. This equates to 0.585°C per decade and this is over a period that people say the warming has stopped!
As expected with opaque cloud cover the temperature is negatively correlated.
Temperature with day of year is as expected with a peak at day 200 (19th July) and a minimum at day 40 (9th February). These dates are of course offset from longest/shortest day.
Plots of the nulled variables:
Note that the nulled portion is sometimes limited to less than whole range. In this case a limit is used to only accept data for that nulled range on that variable
Also the nulling process is only used to produce a line of zero slope for each variable - the offset from zero is not relevant as only anomalies are plotted.
Data from:
http://www.nrel.gov/midc/srrl_bms/
2013/07/08
Subscribe to:
Post Comments (Atom)


No comments:
Post a Comment