Showing posts with label spencer. Show all posts

2017/09/27

I See No Ships (hurricanes)

Why is everyone trying to minimise the suffering of many thousands of people by claiming there has been a long period of no hurricanes in the Atlantic (adding to hit mainland US). There has been no real lull in the number of hurricanes:
e.g from Roy Spencer:
---------------------------------------
The 11-Year Major Hurricane Drought: Much More Unusual than Two Cat 4 Strikes

September 21st, 2017 by Roy W. Spencer, Ph. D.

Weather.com published an article noting that the two Cat 4 hurricane strikes this year (Harvey and Irma) is a new record. Here’s a nice graphic they used showing both storms at landfall...

------------------------------------

Yet from Wiki there are these recorded cat 4 and 5 Atlantic hurricanes:

2001
Iris
October 89
145 mph (230 km/h)
948 hPa
2001
Michelle
November 34
140 mph (220 km/h)
933 hPa
2002
Lili
October 23
145 mph (230 km/h)
938 hPa
2003
Fabian
August 31-September 5
145 mph (230 km/h)
939 hPa
2003
Isabel
September 11-14,
165 mph (270 km/h)
915 hPa
2004
Charley
August 13
150 mph (240 km/h)
941 hPa
2004
Frances
August 28-September 2
145 mph (230 km/h)
935 hPa
2004
Karl
September 20-21
145 mph (230 km/h)
938 hPa
2004
Ivan
September 9-14
165 mph (270 km/h)
910 hPa
2005
Dennis
July 810
150 mph (240 km/h)
930 hPa
2005
Emily
July 16,
160 mph (260 km/h)
929 hPa
2005
Katrina
August 2829
175 mph (280 km/h)
902 hPa
2005
Rita
September 21-22,
180 mph (285 km/h)
895 hPa
2005
Wilma
October 19,
185 mph (295 km/h)
882 hPa
2007
Dean
August 18-21,
175 mph (280 km/h)
905 hPa
2007
Felix
September 34,
175 mph (280 km/h)
929 hPa
2008
Gustav
August 30-31
155 mph (250 km/h)
941 hPa
2008
Ike
September 48
145 mph (230 km/h)
935 hPa
2008
Omar
October 16
130 mph (215 km/h)
958 hPa
2008
Paloma
November 8
145 mph (230 km/h)
944 hPa
2009
Bill
August 19-20
130 mph (215 km/h)
943 hPa
2010
Danielle
August 27
130 mph (215 km/h)
942 hPa
2010
Earl
August 30-September 2
145 mph (230 km/h)
927 hPa
2010
Igor
September 12-17
155 mph (250 km/h)
924 hPa
2010
Julia
September 15
140 mph (220 km/h)
948 hPa
2011
Katia
September 6
140 mph (220 km/h)
942 hPa)
2011
Ophelia
October 2
140 mph (220 km/h)
940 hPa
2014
Gonzalo
October 15-17
145 mph (230 km/h)
940 hPa
2015
Joaquin
October 13
155 mph (250 km/h)
931 hPa
2016
Nicole
October 12-13
140 mph (220 km/h)
950 hPa)
2016
Matthew
October 1,
165 mph (270 km/h)
934 hPa
2017
Harvey
August 25-26
130 mph (215 km/h)
938 hPa
2017
Jose
September 8-10
155 mph (250 km/h)
938 hPa
2017
Irma
September 59,
185 mph (295 km/h)
914 hPa
2017
Maria
September 18-20,
175 mph (280 km/h)
908 hPa
You have to be blind in more than one eye to miss these

2017/06/02

What Roy Spencer Thinks of Europe

Just seen an exchange of posts on Spencer's Blog

stavro mueller says:
Salvatore Del Prete says: June 2, 2017 at 5:50 AM
Trump you did the right thing ! Excellent president the best we have ever had.
————
Really?
few other leaders have been made the ultimate laughing stock of the rest of the world.
Even Bush and Regan were more respected
  • I don’t care if we are a laughingstock to a bunch of countries whose claim to fame is artists and musicians who died hundreds of years ago. Some of us laugh at you, too. Your countries are slowly dying, culturally and economically.
    Good luck.
phew!

2014/07/25

What ever you do - do not get your science from the heartland institute

A short video here from heartland doing the usual :
  • All climate scientists are communists
  • All climate scientists want you to live in a fuel impoverished future
  • All climate scientists want you all to die!
https://www.youtube.com/watch?v=HLZElcvkEDs


Has the most ridiculous graphic yet seen:
Now you see it

Now you don't


And these are scienists you are supposed to believe!

2012/09/06

Good God! This is really scary stuff

Who in their right mind would put their name and reputation to this.

WHAT WE BELIEVE


1.We believe Earth and its ecosystems—created by God’s intelligent design and infinite power and sustained by His faithful providence —are robust, resilient, self-regulating, and self-correcting, admirably suited for human flourishing, and displaying His glory. Earth’s climate system is no exception. Recent global warming is one of many natural cycles of warming and cooling in geologic history.

2.We believe ...  

WHAT WE DENY

1.We deny that Earth and its ecosystems are the fragile and unstable products of chance, and particularly that Earth’s climate system is vulnerable to dangerous alteration because of minuscule changes in atmospheric chemistry. Recent warming was neither abnormally large nor abnormally rapid. There is no convincing scientific evidence that human contribution to greenhouse gases is causing dangerous global warming.

...
4.We deny that such policies, which amount to a regressive tax, comply with the Biblical requirement of protecting the poor from harm and oppression.

 http://www.cornwallalliance.org/articles/read/an-evangelical-declaration-on-global-warming/     

now at:
http://www.cornwallalliance.org/2009/05/01/evangelical-declaration-on-global-warming/


Well, here are some signatories they highlight

Dr. Roy W. Spencer (Principal Research Scientist in Climatology, University of Alabama, Huntsville,
Dr. Joseph D’Aleo (Executive Director and Certified Meteorologist, Icecap
Dr. David Legates (Associate Professor of Climatology, University of Delaware
Dr. Ross McKitrick (Associate Professor of Economics, University of Guelph, Ontario, Canada,
Dr. Cornelis van Kooten (Professor of Economics and Research Chair in Environmental Studies and Climate, University of Victoria, British Columbia, Canada, Expert Reviewer, Intergovernmental Panel on Climate Change)
Dr. Kenneth W. Chilton (Founder and Emeritus Director, Institute for the Study of Economics and the Environment, Lindenwood College); 

Contibuting Writers.
:Rev. Richard S. Courtney, Expert Reviewer, Intergovernmental Panel on Climate Change, and Methodist Preacher, Cornwall, UK
G. Cornelis van Kooten, Ph.D., Professor of Economics and Research Chari in Environmental Studies and Climate, University of Victoria, BC, Canada


Advisory board
James A. Wanliss, Ph.D., Associate Professor of Physics, Presbyterian College, Clinton, SC


How can any report from these people be believed? For them to even contemplate suggesting that there is man made climate change would be to deny their Gods omniopotence.
There is only ever one report they can give in order to retain their faith - All in the world is wonderful.
Yet some of these have given reports to governments. Surely this is much worse than ANY collusion/falsification shown in the stolen emails (i.e. none!)

Fragile ecosystems? self regulating? Protecting the poor?

If the poor of the world were to be brought up to the same energy consumption levels of the US (and others) what price would the rich be paying for fuel.

How long would resources of metals fossil fuels uranium last if consumption were leveled at the us values?

This just gets worse:
http://www.cornwallalliance.org/articles/read/a-renewed-call-to-truth-prudence-and-protection-of-the-poor/
EXECUTIVE SUMMARY OF CHAPTER ONE:


THEOLOGY, WORLDVIEW, AND ETHICS OF GLOBAL WARMING POLICY

Earth and all its subsystems—of land, sea, and air, living and nonliving—are the good products of the wise design and omnipotent acts of the infinite, eternal, and unchangeable Triune God of the Bible. As such they reveal God’s glory. Mankind, created in God’s image, is the crown of creation. Human beings have the divine mandate to multiply and to fill, subdue, and rule the Earth, transforming it from wilderness into garden. They act as stewards under God to cultivate and guard what they subdue and rule. Calling them to be His vicegerents over the Earth, God requires obedience to His laws—in Scripture and imprinted in the human conscience—in their stewardship. Although sin, universal among mankind, deeply mars this stewardship, God’s redemptive act in Jesus Christ’s death on the cross and His instructive activity through Scripture, communicating the nature of creation and human responsibility for it, enable people to create wealth and decrease poverty at the same time that they pursue creation stewardship and, even more important, the true spiritual wealth of knowing their Creator through Jesus Christ.

Garden? http://en.wikipedia.org/wiki/File:Hobet_Mountaintop_mine_West_Virginia_2009-06-02.jpg
Garden? http://ngm.nationalgeographic.com/2009/03/canadian-oil-sands/kunzig-text
Garden? http://www.businesspundit.com/the-worlds-worst-environmental-disasters-caused-by-companies/
Garden? http://news.bbc.co.uk/1/hi/sci/tech/3161812.stm
Resilient Ecosystems? http://www.huffingtonpost.co.uk/2012/08/20/uk-fish-stocks-low-brits--cods-haddock_n_1811461.html
Resilient Ecosystems? http://www.bigmarinefish.com/bluefin.html
Resilient Ecosystems? http://www.tigersincrisis.com/
Resilient Ecosystems? http://www.bbc.co.uk/news/science-environment-15663982
Resilient Ecosystems? http://www.time.com/time/photogallery/0,29307,1888702_1863782,00.html
Resilient Ecosystems? http://www.orangutan.org.uk/
Self Regulating? http://en.wikipedia.org/wiki/Extinction_event
Self Regulating? http://geography.about.com/od/globalproblemsandissues/a/trashislands.htm
Self Regulating? http://www.forestry.gov.uk/fr/HCOU-4U4JCL

Ater this visit
http://creationmuseum.org/whats-here/photo-preview/

and see what another saw

http://www.barefootandprogressive.com/2010/12/flashback-fun-at-the-creation-museum-my-field-trip-to-crazyland.html


2011/11/05

Just How good Are Satellite Derived Temperatures (updated)

Many changes have been made to satellite derive temperatures ( I have asked Spencer to explain the differences and unrecorded adjustments on many blogs. BUT never has he bothered to explain).
With the current BEST surface temperature  slanging matches raging on the anti AGW blogs all eyes seem to be turning to the satellite record and opinions seem to suggest that these results are what everyone should be usingas the gold standard (mainly because they only show the last 8 year and these have a cooling trend!!)

What goes up must (in earth orbit) eventually come down.
NOAA-15 was once the satellite producing the temperature records (from 1998) however as the hardware progressively fails the data from the AQUA satellite has been used (data available from 2002)

This gave a 6 year overlap where the temperatures could be compared and corrected. This, according to Leif Svalgaard is what happens with the TSI measurements for solar activity.

My complaint is that there is a LARGE error in data between AQUA and NOAA-15 and no attempt to reconcile the differences is made or explanations given.
Indeed The UAH team handling the data seem to adjust data at a whim.
For example: for channel 05 AQUA between the dates of 2010-07-03 and 2011-10-01 data missing in the earlier plot suddenly appeared in the later plot  (from 2009-02-01 to 2009-02-03 and on 2010-11-25 and 2010-11-26 Why and how? Also in my data the earlier records were one day adrift !! (could have been me however)

People are quibbling about discrepancies of 0.12 K/decade  but looking at the comparison between NOAA-15 data and AQUA this 0.12K/decade is the discrepancies produced by the two satellites and modified by the same team.

Chan 05
.

From the above plot during the overlap period:
NOAA warming is 3.27e-5K/day = 0.119K/decade
AQUA warming is -1.95e-5K/day = -0.0712K/decade
Also of interest is the two plots for the same series but obtained at different times red and blue in the plot these seem to have been revised without explanation (by up to .08K)

Looking at CH 4 data, the current data on their web site runs from 2002 to 2008 (with the last 6 monts failing) The data that was available (NOAA?) went from 1998 to 2011 and despite this being the longer record  is not used on their Discover website.


Again the slope over the valid overlap period is:
AQUA 1.0404e-5K/day = 0.0380K/decade
NOAA 1.1879e-4K/day = 0.434K/decade


Another series CH06


AQUA -4.2323e-5K/day = -0.154K/decade
NOAA -1.7595e-4K/day = -0.642K/decade

Chan 10


AQUA -6.59e-5K/day = -0.2345K/decade
NOAA -9.58e-4K/day = -0.3411K/decade
Chan 13


AQUA -2.1174e-4K/day = -0.754K/decade
NOAA -1.4831e-4K/day = -0.528K/decade

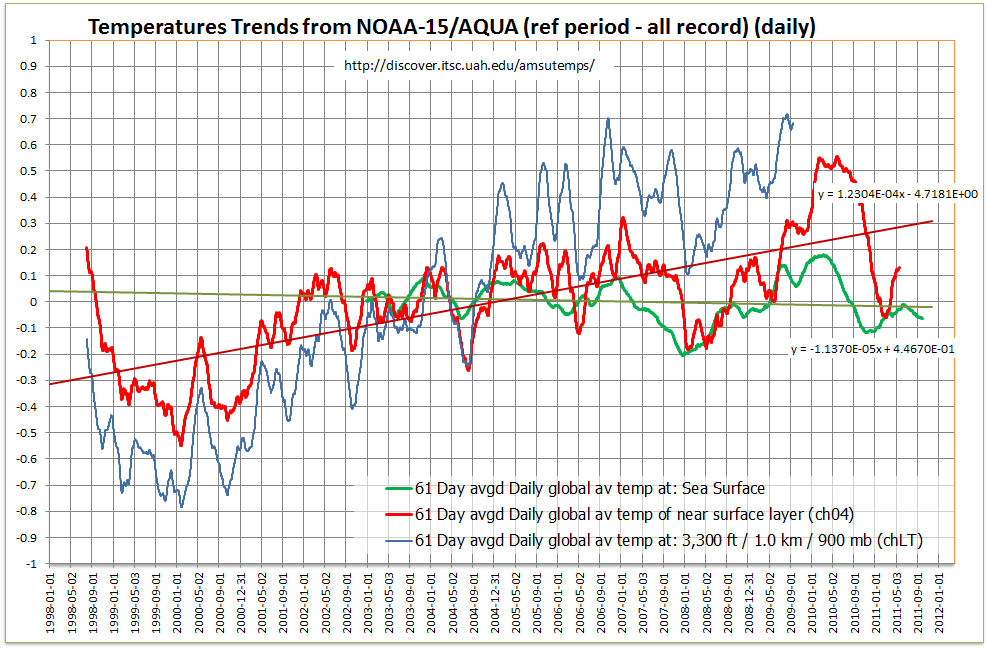
Another plot shows that CHLT (NOAA defunct) and CH04 (recently AQUA defunct) had peaks and troughs occurring at the same time. However comparing CH04 to Sea Surface temperature the temperature of the sea changes BEFORE the air temperature by a couple of months. HOW?


Absolute temperature differences
( CH4 NOAA) - (CH4 AQUA)=-2K
( CH5 NOAA) - (CH5 AQUA)=-0.11K
( CH6 NOAA) - (CH6 AQUA)=-0.99K
( CH10 NOAA) - (CH10 AQUA)=-0.279K
( CH13 NOAA) - (CH13 AQUA)=0.062K
Conclusion

There seems to be many more problems with satellite temperatures than with surface temperatures. Why then are these held up as being the golden standard???

2011/09/12

FFTs Cloud feedback and Stuff

Many "sums" have been done using FFTs and convolution.
It started out with Spencer:


Changed to this with "Bart"


However there seems to me to be problems with all of this.

1.  the data being used is from 10 years only
2.  the data from clear to cloudy sky is not simultaneous
3.  the  data is average over 1 month so can never be safely used to subtract clear from cloudy - the data is smeared over 1 month and can never be data from the same region.
3a. Albedo of soil and water are very different- cloud over water will show a large TOA flux difference wheras the cloud over land will show less outward going flux.
water albedo= 0.02 approx (at some angles)

ground albedo = 0.1 to 0.5
Clouds albedo = 0 to 0.8
Wiki
4.  What about the "insulating" effect of clouds at night. Shouldn't this be included in any flux calculations?
5.  There is no way the data available from Spencer/Dessler/Bart can show the accurate change in flux due to clouds

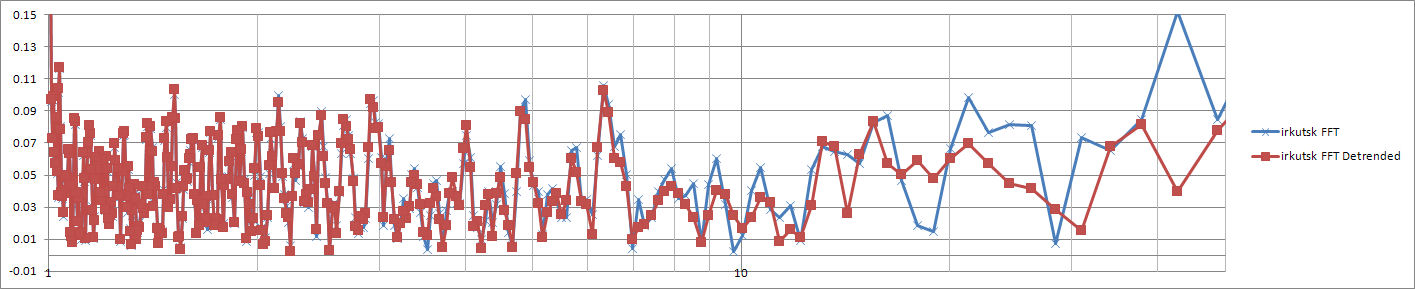
the Plots below are simple spectrums using the FFT function in excel. Note that any thing over 60 years period has very little resolutuion. and these are from 200 year records not 10 year!!.

Also when doing FFT on a non infinite series the trend should be removed before the fft transform is applied as the termination of data at either end causes problems. Using a FFT windowing function will also improve performance.

Comparison between data with a trend and detrended data:


Ocean albedo calc
http://snowdog.larc.nasa.gov/jin/rtset.html

Measurement of ground albedo
http://www.cuepe.ch/html/biblio/pdf/ineichen%201990%20-%20ground-reflected%20radiation%20and%20albedo%20(se).pdf

Variation/validation  of Albedo
http://citeseerx.ist.psu.edu/viewdoc/download?doi=10.1.1.64.6930&rep=rep1&type=pdf

2010/07/21

AMSU unrecorded modifications still not answered.

Some time ago I asked for an explanation from Spencer as to why some of the channels from amsu had been dropped (in particular CHLT which was rising at 1.2C/decade) but also why ch05 was changed to ch05 aqua and then modified to a new version of ch05 aqua. All this with no notes on the discover website.
No explanation was forthcoming.

The major changes have removed the rapidly rising trends. Why?


Note that all FEB 29ths have been removed!

Assuming The AMSU team have now stabilized on their plots ch04 is still showing an upward trend of almost 0.5C per decade

2010/05/02

AMSU Temperature Change per year

plotting the variation in temperature per year for each day produces this plot:


Interestingly the t-rise is not a constant over the year but has a pronounced dip at the beginning of May for lower air temp.

The sea surface temperature is practically flat. There is a peak during the NH summer. Why is this? Isn't the SH ocean bigger and therefore more likely to show an increase during it's summer when averaged globally. Is evaporation producing a stabilising effect which is less effective over the NH?

2010/01/14

Spencer: Clouds Dominate CO2 as a Climate Driver Since 2000
13

01

2010
By Dr. Roy Spencer, PhD.


Last year I posted an analysis of satellite observations of the 2007-08 global cooling event, showing evidence that it was due to a natural increase in low cloud cover. Here I will look at the bigger picture of what how the satellite-observed variations in Earth’s radiative budget compare to that expected from increasing carbon dioxide. Is there something that we can say about the relative roles of nature versus humanity based upon the evidence?

What we will find is evidence consistent with natural cloud variations being the dominant source of climate variability since 2000.

CERES Observations of Global Energy Budget Changes
The following graph shows the variations in the Earth’s global-average radiative energy balance as measured by the CERES instrument on NASA’s Terra satellite. These are variations in the imbalance between absorbed sunlight and emitted infrared radiation, the most fundamental quantity associated with global warming or global cooling. Also show (in red) are theoretically calculated changes in radiative forcing from increasing carbon dioxide as measured at Mauna Loa.


Since there is some uncertainty in the absolute accuracy of the CERES measurements, where one puts the zero line is also somewhat uncertain. Therefore, it’s the variations since 2000 which are believed to be pretty accurate, and the exact dividing line between Earth gaining energy and Earth losing energy is uncertain. Significantly, all of the downward trend is in the reflected sunlight portion, not the infrared portion of the variations. We similarly can not reference where the zero line should be for the CO2 forcing, but the reasons for this are more complex and I will not address them here.

In order to compare the variations in the CO2 forcing (in red) to the satellite observations, we need to account for the fact that the satellite observes forcing and feedback intermingled together. So, let’s remove a couple of estimates of feedback from the satellite measurements to do a more direct comparison.

Inferred Forcing Assuming High Climate Sensitivity (IPCC View)
Conceptually, the variations in the Earth’s radiative imbalance are a mixture of forcing (e.g. increasing CO2; clouds causing temperature changes), and feedback (e.g. temperature changes causing cloud changes). We can estimate the forcing part by subtracting out the feedback part.

First, let’s assume that the IPCC is correct that climate sensitivity is pretty high. In the following chart I have subtracted out an estimate of the feedback portion of the CERES measurements based upon the IPCC 20-model average feedback parameter of 1.4 W m-2 K-1 times the satellite AMSU-measured tropospheric temperature variations


As can be seen, the long-term trend in the CERES measurements is much larger than can be accounted for by increasing carbon dioxide alone, which is presumably buried somewhere in the satellite-measured signal. In fact, the satellite observed trend is in the reflected sunlight portion, not the infrared as we would expect for increasing CO2 (not shown).

Inferred Forcing Assuming Low Climate Sensitivity (”Skeptical” View)
There has been some published evidence (our 2007 GRL paper, Lindzen & Choi’s 2009 paper) to suggest the climate system is quite insensitive. Based upon that evidence, if we assume a net feedback parameter of 6 W m-2 K-1 is operating during this period of time, then removing that feedback signal using AMSU channel 5 yields the following history of radiative forcing:


As can be seen, the relative size of the natural forcings become larger since more forcing is required to cause the same temperature changes when the feedback fighting it is strong. Remember, the NET feedback (including the direct increase in emitted IR) is always acting against the forcing…it is the restoring force for the climate system.

What this Might Mean for Global Warming
The main point I am making here is that, no matter whether you assume the climate system is sensitive or insensitive, our best satellite measurements suggest that the climate system is perfectly capable of causing internally-generated radiative forcing larger than the “external” forcing due to increasing atmospheric carbon dioxide concentrations. Low cloud variations are the most likely source of this internal radiative forcing. It should be remembered that the satellite data are actually measured, whereas the CO2 forcing (red lines in the above graphs) is so small that it can only be computed theoretically.

The satellite observed trend toward less energy loss (or, if you prefer, more energy gain) is interesting since there was no net warming observed during this time. How could this be? Well, the satellite observed trend must be due to forcing only since there was no warming or cooling trend during this period for feedback to act upon. And the lack of warming from this substantial trend in the forcing suggests an insensitive climate system.

If one additionally entertains the possibility that there is still considerable “warming still in the pipeline” left from increasing CO2, as NASA’s Jim Hansen claims, then the need for some natural cooling mechanism to offset and thus produce no net warming becomes even stronger. Either that, or the climate system is so insensitive to increasing CO2 that there is essentially no warming left in the pipeline to be realized. (The less sensitive the climate system, the faster it reaches equilibrium when forced with a radiative imbalance.)

Any way you look at it, the evidence for internally-forced climate change is pretty clear. Based upon this satellite evidence alone, I do not see how the IPCC can continue to ignore internally-forced variations in the climate system. The evidence for its existence is there for all to see, and in my opinion, the IPCC’s lack of diagnostic skill in this matter verges on scientific malpractice.
--------------------------------------------------------
Thank you Dr Spencer for this.

So proof at last that Kevin Trenberth is correct in his travesty email
the energy in is greater than the energy out = warming (not seen!!!)

Kevin Trenberth:
" The fact is that we can't account for the lack of warming at the moment and it is a travesty that we can't. The CERES data published in the August BAMS 09 supplement on 2008 shows there should be even more warming: but the data are surely wrong. Our observing system is inadequate."
....
" We are not close to balancing the energy budget. The fact that we can not account for what is happening in the climate system makes any consideration of geoengineering quite hopeless as we will never be able to tell if it is successful or not! It is a travesty!"

Michael Mann wrote:
" Kevin, that's an interesting point. As the plot from Gavin I sent shows, we can easily account for the observed surface cooling in terms of the natural variability seen in the CMIP3 ensemble (i.e. the observed cold dip falls well within it). So in that sense, we can "explain" it. But this raises the interesting question, is there something going on here w/ the energy & radiation budget which is inconsistent with the modes of internal variability that leads to similar temporary cooling periods within the models.
I'm not sure that this has been addressed--has it?"

Perhaps an apology to Trenberth is in order?

Spencer attribute the warming to clouds - this does not seem to agree with Svensmark where increased clouds = cooling.
Also clouds should be increasing - causing cooling - due to increased GCRs with quiet sun.

Would it be fair to say it is a travesty?
..........
GCR-climate connection - GCR’s increase low cloud cover via increased CCN production (via increased atmospheric ionization), which acts as a cooling effect on the climate.
IPCC
6.11.2.2 Cosmic rays and clouds
Svensmark and Friis-Christensen (1997) demonstrated a high degree of correlation between total cloud cover, from the ISCCP C2 data set, and cosmic ray flux between 1984 and 1991. Changes in the heliosphere arising from fluctuations in the Sun's magnetic field mean that galactic cosmic rays (GCRs) are less able to reach the Earth when the Sun is more active so the cosmic ray flux is inversely related to solar activity.
boballab (16:49:58) :
Last year I posted an analysis of satellite observations of the 2007-08 global cooling event, showing evidence that it was due to a natural increase in low cloud cover.
Low level Clouds=COOLING
Lack of low level Clouds=WARMING
Not
more low level clouds=Warming
Spencer agrees with Svenmark more clouds, more cooling


Low solar activity = high gcrs
high gcr=more low cloud=cooling = svensmark

as solar minimum was approached (=high gcrs=cooling=svensmark) the plots above show earth gaining excess energy.
I do not, I admit, understand how more energy = cooling
The plots show CO2 line doing the correct thing more co2=earth gaining excess energy so the plots are named correctly.

To me svensmark does not equal spencer
but trenberth = honest:
The fact is that we can’t account for the lack of warming at the moment and it is a travesty that we can’t. The CERES data published in the August BAMS 09 supplement on 2008 shows there should be even more warming: but the data are surely wrong. Our observing system is inadequate"

svensmark says -ve
spencer says +ve
trenberth says our observing system is inadequate.

Who is being honest here?