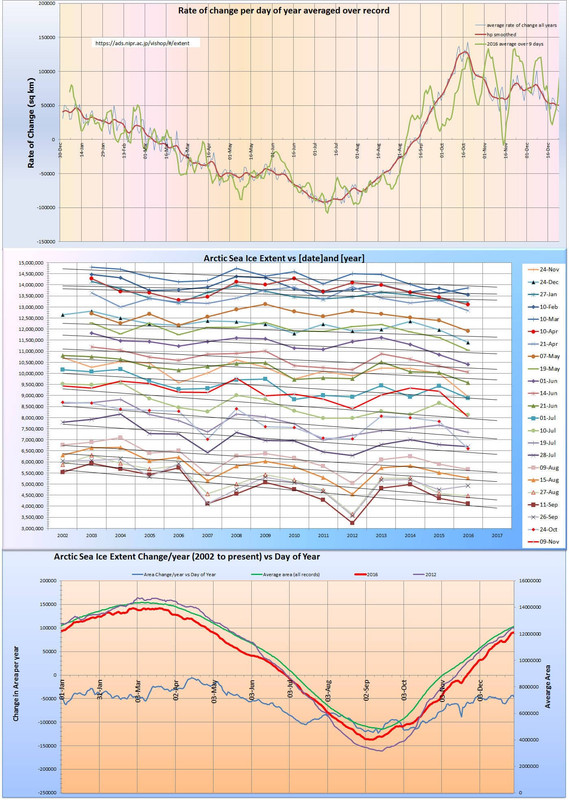
The plot below is made using data from ADS NIPR Arctic Sea Ice Extent https://ads.nipr.ac.jp/vishop/#/extent
Showing posts with label arctic sea ice. Show all posts
2020/09/28
2020/01/04
2019/11/27
November Arctic Sea Ice And Temperature
An update on the sea ice extent from Jaxa
https://ads.nipr.ac.jp/vishop/#/extent
and Arctic temperature from DMI
http://ocean.dmi.dk/arctic/meant80n.uk.php
https://ads.nipr.ac.jp/vishop/#/extent
and Arctic temperature from DMI
http://ocean.dmi.dk/arctic/meant80n.uk.php
Labels:
arctic sea ice,
arctic temperature,
DIM,
jaxa,
sea ice,
vishop
2019/10/09
Unusual Arctic Sea Ice Autumn Rate of Gain of Extent
2019-10-08
Rate of gain as winter approaches has flattened and is significantly less than 2012 at this date:
The DMI actic temperature reflects the Ice state:
Rate of gain as winter approaches has flattened and is significantly less than 2012 at this date:
The DMI actic temperature reflects the Ice state:
Labels:
arctic sea ice,
DIM,
sea ice
2019/08/16
Arctic Sea Ice 2019-08-15
Latest update
Still shows a likely 2019 minimum of around 4.1 million km2
But unlikely to be below 2012 minimum
Still shows a likely 2019 minimum of around 4.1 million km2
But unlikely to be below 2012 minimum
Labels:
arctic,
arctic sea ice,
north pole
2019/08/05
Arctic Sea Ice 2019-08-05
Arctic Sea Ice Extent from ADS
Data is lining up to be a normal reduction in extent (i.e. not an exceptional loss like 2012).
This would give a 2019 minimum of around 4.1 million km2 if rate of loss is maintained
Labels:
arctic,
arctic sea ice,
north pole
2019/06/19
ADS Arctic Sea ice mid June 2019
Plots with latest Data 18th June 2019
Rate of loss seems consistent with previous years.
data from ADS Vishop
Labels:
arctic,
arctic sea ice,
jaxa
2019/04/26
Sea ice 2019 April
Some growth this year after the onset of melt season - but overall the decline in extent continues as normal (see second plot).
Data from https://ads.nipr.ac.jp/vishop/#/extent
Some changes to plots from previous versions.
Labels:
arctic sea ice,
north pole,
sea ice
2018/12/21
Arctic Sea ice - December
A December update on Arctic Sea Ice as reported by JAXA.
Some wild swings especially in last few days (problem with measurement??)
The data now includes all years available from JAXA (1979 to present)
| https://ads.nipr.ac.jp/vishop/#/extent |
The data now includes all years available from JAXA (1979 to present)
Labels:
arctic sea ice,
sea ice
2018/07/02
2017/10/07
2017/01/23
Arctic Sea Ice to December 2016
First plot shows rate of change per day - Note wild fluctuations from October
Second plot show Extent on day of year - A few have line fits which show that the extent reduction is a reasonable fit to a straight lineThe final plot shows the usual plus a rate of change per year.
Labels:
arctic sea ice
2012/12/29
What DID happen to the ice during the Arctic Storm?
The daily rate of change is plotted below:
During the storm period 3 days show increased loss. Over the 2007 loss this is 292812 sq km
WUWT claim that this loss exposed more ice to later attack but only 2 other periods show gross changes:
During the period 15th August to 17th August (additional loss over 2007 is 178438 sq km)
During the period 22nd August to 23rd August (additional loss over 2007 is 174687 sq km)
So the Absolute maximum loss that could possibly be attributed to the "Great Arctic Storm" of 2012 is 645937 sq km.
The difference between the 2007 and 2012 minimum is 765468sq km
So even if you subtract the largest possible storm induced loss you would still have a 119531 sq km additional loss in 2012 when compared to 2007.
During the storm period 3 days show increased loss. Over the 2007 loss this is 292812 sq km
WUWT claim that this loss exposed more ice to later attack but only 2 other periods show gross changes:
During the period 15th August to 17th August (additional loss over 2007 is 178438 sq km)
During the period 22nd August to 23rd August (additional loss over 2007 is 174687 sq km)
So the Absolute maximum loss that could possibly be attributed to the "Great Arctic Storm" of 2012 is 645937 sq km.
The difference between the 2007 and 2012 minimum is 765468sq km
So even if you subtract the largest possible storm induced loss you would still have a 119531 sq km additional loss in 2012 when compared to 2007.
Labels:
arctic sea ice,
arctic storm,
wuwt
2012/09/30
2012/08/28
Arctic Ice - The lady's not for turning (in the words of Thatcher)
Now at the last linear monthly fit before the minimum (see last plot). Been expecting the rate of loss to reduce but little change for weeks.
The plots now look like:
Nothing to say really - It is just incredibly odd.1
Labels:
arctic sea ice
2012/08/16
2012/08/03
Latest Arctic Ice data
Data plotted to 2nd August (valid to 1st August - area usually changes upwards when next averaged)
Ice loss seems on target to be minimum at around 4.55e6 km^2 this year
Since the projected minimum is likely to be greater than 2007 This will allow Tony and followers to claim 5 years of arctic ice recovery!
Labels:
arctic sea ice,
wuwt
2012/07/18
2012/07/14
The death of Arctic Web Cam 2 ?
11th July note horizon angle and compare to previous post and picture below 12 July
The last picture on the website for camera 2 on 12th July - Horizon levelled again
13th July picture from webcam 1 - Sill more surface water
Labels:
arctic sea ice,
webcam
2012/07/07
NP Web Cams - Loads of Water
Webcam 2 seems to show footprints in snow!
Webcam 1 sits on an island of snow in the surface water.
Melting similar to 2011 (perhaps a bit later)
The webcams have moved about 4 deg south since installation:
So what about the mass of ice:
Labels:
arctic sea ice,
north pole,
webcam
Subscribe to:
Posts (Atom)