Many "sums" have been done using FFTs and convolution.
It started out with Spencer:
Changed to this with "Bart"
However there seems to me to be problems with all of this.
1. the data being used is from 10 years only
2. the data from clear to cloudy sky is not simultaneous
3. the data is average over 1 month so can never be safely used to subtract clear from cloudy - the data is smeared over 1 month and can never be data from the same region.
3a. Albedo of soil and water are very different- cloud over water will show a large TOA flux difference wheras the cloud over land will show less outward going flux.
water albedo= 0.02 approx (at some angles)
ground albedo = 0.1 to 0.5
Clouds albedo = 0 to 0.8
Wiki
4. What about the "insulating" effect of clouds at night. Shouldn't this be included in any flux calculations?
5. There is no way the data available from Spencer/Dessler/Bart can show the accurate change in flux due to clouds
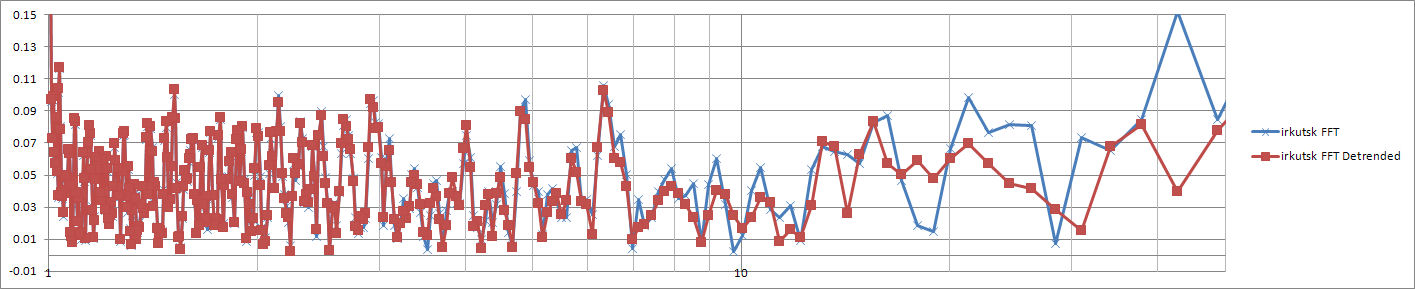
the Plots below are simple spectrums using the FFT function in excel. Note that any thing over 60 years period has very little resolutuion. and these are from 200 year records not 10 year!!.
Also when doing FFT on a non infinite series the trend should be removed before the fft transform is applied as the termination of data at either end causes problems. Using a FFT windowing function will also improve performance.
Comparison between data with a trend and detrended data:
Ocean albedo calc
http://snowdog.larc.nasa.gov/jin/rtset.html
Measurement of ground albedo
http://www.cuepe.ch/html/biblio/pdf/ineichen%201990%20-%20ground-reflected%20radiation%20and%20albedo%20(se).pdf
Variation/validation of Albedo
http://citeseerx.ist.psu.edu/viewdoc/download?doi=10.1.1.64.6930&rep=rep1&type=pdf