The US Laws are aimed at web sites outside the US apparently (sites in the US are well controlled)!
In my view you should abide by the laws of your place of residence - Just because Saudi has laws against drinking must no mean that it is illegal to drink in the UK. It must also not mean that the Saudi authoritories cannot demand that all alcoholics in the UK must be extradited to Saudi for trial.
So why is it possible for the US to demand the UK extradites a student who has broken no UK law - it is not illegal in the UK to show links to sites hosting movies and TV programmes (illegal). This is just what search engines do after all!
This is what has happened to Richard O’Dwyer - the UK has extradition agreements with the US and the media moguls have demanded extradition to the US for trial against THEIR laws
See UK citizen Richard O’Dwyer’s case:
http://www.independent.co.uk/news/uk/crime/student-to-face-us-trial-over-tvshack-website-6289235.html
Other court cases have proven his web site was legal in the UK.
Does one search the world for the most sensitive nations and force everyone to adopt their laws?
If you are in the UK write to your MP about Richard O’Dwyer's case – extradition makes no sense for someone who has broken no current UK laws!
Let this one go and who knows what flood gates get opened.
2012/01/19
2012/01/14
2012/01/02
Are Adiabatic Lapse Rates Controlling Temperatures
Better stuff here on adiabatic lapse rates!!
http://scienceofdoom.com/2012/08/12/temperature-profile-in-the-atmosphere-the-lapse-rate/
Some of the rest is interesyting in this post:
Adiabatic Lapse Rates
wiki
Types of lapse rates
There are two types of lapse rate:
Environmental lapse rate – which refers to the actual change of temperature with altitude for the stationary atmosphere (i.e. the temperature gradient)
The adiabatic lapse rates – which refer to the change in temperature of a parcel of air as it moves upwards (or downwards) without exchanging heat with its surroundings. The temperature change that occurs within the air parcel reflects the adjusting balance between potential energy and kinetic energy of the molecules of gas that comprise the moving air mass. There are two adiabatic rates:[6] Dry adiabatic lapse rate
Moist (or saturated) adiabatic lapse rate
http://www4.uwsp.edu/geO/faculty/ritter/geog101/textbook/atmospheric_moisture/lapse_rates_1.html
In "The Atmosphere" we discovered that air temperature usually decreases with an increase in elevation through the troposphere. The decrease in temperature with elevation is called the environmental lapse rate of temperature or normal lapse rate of temperature. Recall that the normal lapse rate of temperature is the average lapse rate of temperature of .65o C / 100 meters. The environmental lapse rate of temperature is the actual vertical change in temperature on any given day and can be greater or less than .65o C / 100 meters. Also recall that the decrease in temperature with height is caused by increasing distance from the source of energy that heats the air, the Earth's surface. Air is warmer near the surface because it's closer to its source of heat. The further away from the surface, the cooler the air will be. It's like standing next to a fire, the closer you are the warmer you'll feel. Temperature change caused by an exchange of heat between two bodies is called diabatic temperature change. There is another very important way to change the temperature of air called adiabatic temperature change.
http://daphne.palomar.edu/jthorngren/adiabatic_processes.htm
Make sure you notice that we are talking about moving air (rising or subsiding), not still air. The change in temperature of still air (that is, air that is not rising or subsiding) follows the Environmental Lapse Rate, which varies considerably, but averages about 6.5 deg C/1000 meters (3.6 deg/1000 feet). In still air, if you went up in a hot air balloon, carrying a thermometer and taking the air temperature every 1000 meters, on average the temperature would drop 6.5 degrees C every 1000 meters. The rate of temperature change as you rise in still air is not as great as the rate of change of rising air; that is, the air parcel does not cool off as fast.
For instance, the air temperature at sea level is 28 degrees C. Climb into your balloon, release the tethers, and go up 1000 meters in the still air. On average, the air temperature 1000 meters up will be _21.5___degrees C. If the air were rising, and the temperature at sea level was 28 degrees C, what would the temperature of the air be after it rose 1000 meters? 18C
http://www.sci.uidaho.edu/scripter/geog100/lect/05-atmos-water-wx/05-part-7-atmos-lifting-fronts/ch5-part-7a-atmos-liftin.htm
http://www.geographypages.co.uk/lapse.htm
http://www.st-andrews.ac.uk/~dib2/climate/lapserates.html
People talk of adiabatit lapse rates as if they control the atmosperic temperatre. Why?
These lapse rates refer to moving a number of molecules from low pressure to high pressure and getting heated. No problem with that. BUT
For every molecule moved down to high press ure there must be a molecule moved from high to low. It cannot be a one way transport (obviously!).
So, in my books, the heating effect of falling molecules equals the cooling effect of rising molecules. Hence no effect.
So Why is it colder up a mountain than on the plains.
GHG free air absorbs litle of the available sunlight. Air with GHGs absorbs only at the known absoption frequencies and the proportion of theses frequencies in the TSI is relatively small. There is therefore little air heating due to sunlight.
However sunlight hits the ground and 70% gets absorbed and reradiated as heat at long wave infra red frequencies. These will heat the air via absoption. There is more close ground creating warming in a valley than on a hill hence it will be warmer.
NOW if there is a 1000 metre plateau will this be as warm as the valley below - if not, why not?
from WUWT
The adiabatic lapse rate is defined by the "gas Laws" not by gravity (other than of course high gravity gives high pressure!).
The adiabatic lapse rate requires that a fixed number of molecules be moved between pressure differences. Once at a new pressure the new temperature will stabilise to the surroundings (but that is not what adiabatic lapse rate is about).
However, for every molecule transported from high to low pressure there MUST be a molecule transported from low to high pressure. This means there is NO net flow of energy.
Where the atmosphere blends into a vacuum there can be no convective/conductive transfer of energy (there is nothing to transfer the energy to!)
Radiation is the only option. N2 H2 O2 etc. have little propensity to absorb radiation. Hoever they will get warm by transfer of heat from GH gasses. All hot bodies emit radiation (bb radiation).
At the other end of the air column you have similar problems. The ground/sea warms through absorption of the shorter wavelengths of TSI (where most of the solar energy is). The heat is radiated from the ground/sea as LWIR and by contact at the boundary between earth and atmosphere. The heat must be transferred from molecule to molecule by contact or by convection. A slow process. Conduction will be enhanced by high pressure, convection will be slowed.
The radiated energy is NOT significantly absorbed by O2 N2 H2 etc. no matter what the pressure. Even a solid glass fibre can be made extremely low loss 0.2dB per km and the molecules are pretty solidly packed http://www.fiberoptics4sale.com/wordpress/optical-fiber-loss-and-attenuation/ . Without a GHG this radiation would escape without attenuation straight to space. GHGs will "absorb" this LWIR at certain frequencies and re-emit it in all directions.The time for this energy to be "reabsorbed" in another molecule is dependent on the path length which is dependent on the proximity of other GHG molecules which is dependant on the pressure of the atmosphere.
The time taken for the radiation to bounce from molecule to molecule increases the time it takes for the energy to travel from ground to space.
The energy input to the system is at a constant rate. Slow down the output and the system gets hotter. A hotter system will radiate more energy (BB radiation).
Where does the energy from static pressure difference come in to this?

Figure 2
Forcing, and Fractional Cloud Cover over the South Polehttp://www.webpages.uidaho.edu/~vonw/pubs/TownEtAl_2005.pdf
So where does all that downward radiation come from (at least 270W/sqm)
It can only be from GHGs.
Cloud transmission (from above-FTIR looking down) from
An introduction to atmospheric radiation
By Kuo-Nan Liou

Transmission through the atmosphere. If GH effect exists then there should be mmissing parts of emission spectrum when looking at the earth. AND when looking up at the sky there should be higher levels of radiation at the same wavelengt as is missing when looking down. Is this the case? It seems so:

IR great plains measured here:
SGP Central Facility, Ponca City, OK
36° 36' 18.0" N, 97° 29' 6.0" W
Altitude: 320 meters
http://www.arm.gov/sites/sgp
Better stuff here!!
http://scienceofdoom.com/2012/08/12/temperature-profile-in-the-atmosphere-the-lapse-rate/
http://scienceofdoom.com/2012/08/12/temperature-profile-in-the-atmosphere-the-lapse-rate/
Some of the rest is interesyting in this post:
Adiabatic Lapse Rates
wiki
Types of lapse rates
There are two types of lapse rate:
Environmental lapse rate – which refers to the actual change of temperature with altitude for the stationary atmosphere (i.e. the temperature gradient)
The adiabatic lapse rates – which refer to the change in temperature of a parcel of air as it moves upwards (or downwards) without exchanging heat with its surroundings. The temperature change that occurs within the air parcel reflects the adjusting balance between potential energy and kinetic energy of the molecules of gas that comprise the moving air mass. There are two adiabatic rates:[6] Dry adiabatic lapse rate
Moist (or saturated) adiabatic lapse rate
http://www4.uwsp.edu/geO/faculty/ritter/geog101/textbook/atmospheric_moisture/lapse_rates_1.html
In "The Atmosphere" we discovered that air temperature usually decreases with an increase in elevation through the troposphere. The decrease in temperature with elevation is called the environmental lapse rate of temperature or normal lapse rate of temperature. Recall that the normal lapse rate of temperature is the average lapse rate of temperature of .65o C / 100 meters. The environmental lapse rate of temperature is the actual vertical change in temperature on any given day and can be greater or less than .65o C / 100 meters. Also recall that the decrease in temperature with height is caused by increasing distance from the source of energy that heats the air, the Earth's surface. Air is warmer near the surface because it's closer to its source of heat. The further away from the surface, the cooler the air will be. It's like standing next to a fire, the closer you are the warmer you'll feel. Temperature change caused by an exchange of heat between two bodies is called diabatic temperature change. There is another very important way to change the temperature of air called adiabatic temperature change.
http://daphne.palomar.edu/jthorngren/adiabatic_processes.htm
Make sure you notice that we are talking about moving air (rising or subsiding), not still air. The change in temperature of still air (that is, air that is not rising or subsiding) follows the Environmental Lapse Rate, which varies considerably, but averages about 6.5 deg C/1000 meters (3.6 deg/1000 feet). In still air, if you went up in a hot air balloon, carrying a thermometer and taking the air temperature every 1000 meters, on average the temperature would drop 6.5 degrees C every 1000 meters. The rate of temperature change as you rise in still air is not as great as the rate of change of rising air; that is, the air parcel does not cool off as fast.
For instance, the air temperature at sea level is 28 degrees C. Climb into your balloon, release the tethers, and go up 1000 meters in the still air. On average, the air temperature 1000 meters up will be _21.5___degrees C. If the air were rising, and the temperature at sea level was 28 degrees C, what would the temperature of the air be after it rose 1000 meters? 18C
http://www.sci.uidaho.edu/scripter/geog100/lect/05-atmos-water-wx/05-part-7-atmos-lifting-fronts/ch5-part-7a-atmos-liftin.htm
http://www.geographypages.co.uk/lapse.htm
http://www.st-andrews.ac.uk/~dib2/climate/lapserates.html
People talk of adiabatit lapse rates as if they control the atmosperic temperatre. Why?
These lapse rates refer to moving a number of molecules from low pressure to high pressure and getting heated. No problem with that. BUT
For every molecule moved down to high press ure there must be a molecule moved from high to low. It cannot be a one way transport (obviously!).
So, in my books, the heating effect of falling molecules equals the cooling effect of rising molecules. Hence no effect.
So Why is it colder up a mountain than on the plains.
GHG free air absorbs litle of the available sunlight. Air with GHGs absorbs only at the known absoption frequencies and the proportion of theses frequencies in the TSI is relatively small. There is therefore little air heating due to sunlight.
However sunlight hits the ground and 70% gets absorbed and reradiated as heat at long wave infra red frequencies. These will heat the air via absoption. There is more close ground creating warming in a valley than on a hill hence it will be warmer.
NOW if there is a 1000 metre plateau will this be as warm as the valley below - if not, why not?
from WUWT
The adiabatic lapse rate is defined by the "gas Laws" not by gravity (other than of course high gravity gives high pressure!).
The adiabatic lapse rate requires that a fixed number of molecules be moved between pressure differences. Once at a new pressure the new temperature will stabilise to the surroundings (but that is not what adiabatic lapse rate is about).
However, for every molecule transported from high to low pressure there MUST be a molecule transported from low to high pressure. This means there is NO net flow of energy.
Where the atmosphere blends into a vacuum there can be no convective/conductive transfer of energy (there is nothing to transfer the energy to!)
Radiation is the only option. N2 H2 O2 etc. have little propensity to absorb radiation. Hoever they will get warm by transfer of heat from GH gasses. All hot bodies emit radiation (bb radiation).
At the other end of the air column you have similar problems. The ground/sea warms through absorption of the shorter wavelengths of TSI (where most of the solar energy is). The heat is radiated from the ground/sea as LWIR and by contact at the boundary between earth and atmosphere. The heat must be transferred from molecule to molecule by contact or by convection. A slow process. Conduction will be enhanced by high pressure, convection will be slowed.
The radiated energy is NOT significantly absorbed by O2 N2 H2 etc. no matter what the pressure. Even a solid glass fibre can be made extremely low loss 0.2dB per km and the molecules are pretty solidly packed http://www.fiberoptics4sale.com/wordpress/optical-fiber-loss-and-attenuation/ . Without a GHG this radiation would escape without attenuation straight to space. GHGs will "absorb" this LWIR at certain frequencies and re-emit it in all directions.
Atmospheric longwave irradiance uncertainty: Pyrgeometers compared to an absolute sky-scanning radiometer, atmospheric emitted radiance interferometer, and radiative transfer model calculations.

================
Downward longwave irradiance uncertainty under arctic atmospheres: Measurements and modeling
http://www.slf.ch/ueber/mitarbeiter/homepages/marty/publications/Marty2003_IPASRCII_JGR.pdfFigure 2
Spectral and Broadband Longwave Downwelling Radiative Fluxes, Cloud Radiative
Forcing, and Fractional Cloud Cover over the South Polehttp://www.webpages.uidaho.edu/~vonw/pubs/TownEtAl_2005.pdf
Measurement of night time downward radiation
So we know the solar output received in the dark is 0
We know that O2 and N2 have very very very little thermal radiation.So where does all that downward radiation come from (at least 270W/sqm)
It can only be from GHGs.
During the day we receive about 380W/sqm
So the 270W/sqm is additional to the solar irradiance.
So the average night day temp difference is less than expected (no sideways conduction/wind required)
N2 O2 absoptions are mainly rotational and thereefore mainly in the microwave region. There is not a great amount of radiation in these frequencies.
Cloud transmission (from above-FTIR looking down) from
An introduction to atmospheric radiation
By Kuo-Nan Liou
Transmission through the atmosphere. If GH effect exists then there should be mmissing parts of emission spectrum when looking at the earth. AND when looking up at the sky there should be higher levels of radiation at the same wavelengt as is missing when looking down. Is this the case? It seems so:

spectral plot is here:
http://www.patarnott.com/atms749/powerpoint/ch6_GP.pptIR great plains measured here:
SGP Central Facility, Ponca City, OK
36° 36' 18.0" N, 97° 29' 6.0" W
Altitude: 320 meters
http://www.arm.gov/sites/sgp
Better stuff here!!
http://scienceofdoom.com/2012/08/12/temperature-profile-in-the-atmosphere-the-lapse-rate/
2011/11/24
Confirmation of the Green House Effect
The Effect of CO2 on IR


Conclusion
CO2 in these two instances caused between 6 and 10% greater heating rate
The temperature gradient of the "air" is the reverse of what would be expected with convection or radiation (the higer up the flask the probe the cooler the air)
http://www.spectralcalc.com/blackbody_calculator/blackbody.php
373K
Radiant emmittance: 1097.64 W/m2
Radiance: 349.389 W/m2/sr
Peak spectral radiance: 29.5722 W/m2/sr/µm
Wavelength of peak: 7.76877 µm
298k
Radiant emmittance: 447.186 W/m2
Radiance: 142.344 W/m2/sr
Peak spectral radiance: 9.62545 W/m2/sr/µm
Wavelength of peak: 9.724 µm
100C source is 135mm+125mm-45mm from top thermocouple
top thermocouple is 45 mm from re-radiator
The heating effect of the top 100C source is therefore reduced by 45^2/ 215^2
The green trace below is radiation from the 101C source.
The Blue trace is the upward long wave radiation from the 25C collector.


The Setup
Volume of trapped air in Vacuum Flask 541ml
Air is in a vacuum thermal flask made of double skin stainless steel designed for isolation of liquid from external temperature influenceVolume of trapped air in Vacuum Flask 541ml
IR Absorber used to collect IR is 18g matt black anodised corrugated aluminium rectangular block 40mm by 44mm
Distance from end of tube to top of absorber is 128mmIR Transmitter is 49mm diameter matt black aluminium
Thermal conduction isolation provide by 135mm tube with internal convection cooling internal diameter 49mmAir exchange isolation provided by low density polyethylene (LDPE “cling film”)
Test Set up
Method
1 Temperature recorded at 1 second intervals using an eight channel USB thermocouple interface
2 Apparatus set up as shown but with the IR transmitter isolated from the system. The Internal volume of the vacuum flask was filled with room temperature air (RH approx 50%). The flask then had 60ml of CO2 injected (3 lots of 20ml) (This increases the concentration of CO2 but not to the full 60ml as each injection would displace some of the already injected CO2).
3 IR Transmitter maintained at greater than 100C whilst thermocouple temperatures stabilised
4 When stability reached IR transmitter cooled to 101C and placed on top of tube
5 Temperature of IR transmitter maintained as stable as possible at approximately 100°C during the heating of the gas to greater than 25°C
6 The IR source was removed and the vacuum flask air replaced with room air (using a small fan).
7 The system was then cooled by placing ice cubes in a glass on the LDPE film on the vacuum flask.
8 The system was then reassembled but without the IR source.
9 The air temperature was the allowed to stabilise.
9 The test method was repeated until the air temperature was above 25°C
10 The Air in the flask was then enhanced with CO2 and cooled again, repeating the same method as above
11 The same method was also run (with CO2 and normal done in reverse order) on a previous occasion.
11 The same method was also run (with CO2 and normal done in reverse order) on a previous occasion.
The Results:
1 Using the last 2 runs (room air then CO2 enhanced room air) and measuring the slope of temperature rise per second at around 25°C shows a significant increase with more CO2
2 Also the temperature array record a smaller spread with increased CO2.


Conclusion
CO2 in these two instances caused between 6 and 10% greater heating rate
The temperature gradient of the "air" is the reverse of what would be expected with convection or radiation (the higer up the flask the probe the cooler the air)
http://www.spectralcalc.com/blackbody_calculator/blackbody.php
373K
Radiant emmittance: 1097.64 W/m2
Radiance: 349.389 W/m2/sr
Peak spectral radiance: 29.5722 W/m2/sr/µm
Wavelength of peak: 7.76877 µm
298k
Radiant emmittance: 447.186 W/m2
Radiance: 142.344 W/m2/sr
Peak spectral radiance: 9.62545 W/m2/sr/µm
Wavelength of peak: 9.724 µm
100C source is 135mm+125mm-45mm from top thermocouple
top thermocouple is 45 mm from re-radiator
The heating effect of the top 100C source is therefore reduced by 45^2/ 215^2
The green trace below is radiation from the 101C source.
The Blue trace is the upward long wave radiation from the 25C collector.


CO2 3 times more absorption at 4um than 15um
BB radiation curve shows that 4um absorption and 16um absorption are similar when sensitivity is considered
101C curve always adds less energy to CO2 than 25C re-radiator at 45mm Sensor. The difference will increase as the sensor distance from the re-radiator decreseas
2011/11/05
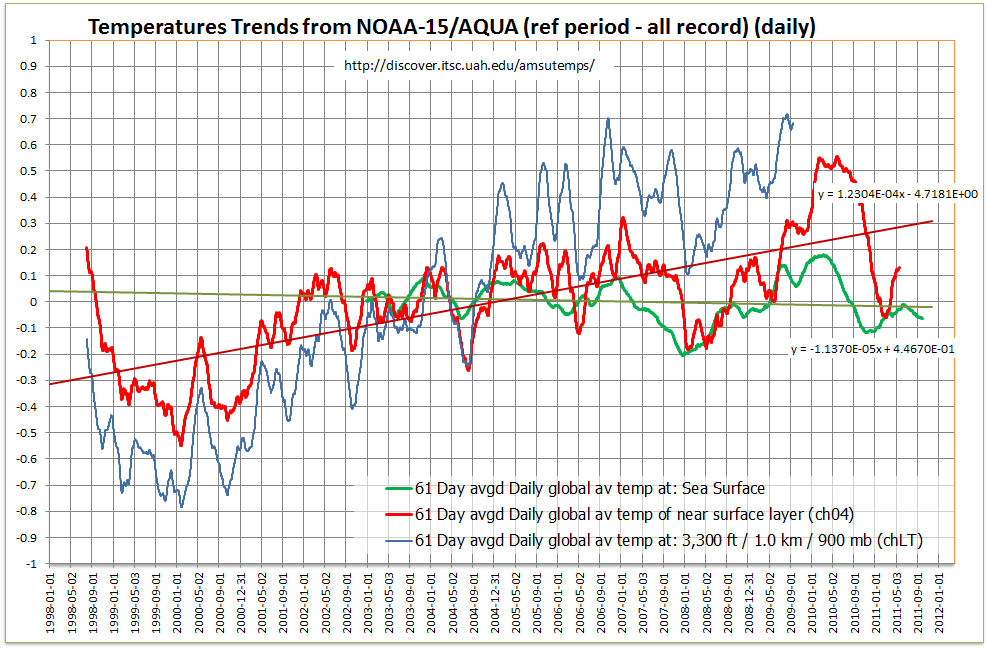
Just How good Are Satellite Derived Temperatures (updated)
Many changes have been made to satellite derive temperatures ( I have asked Spencer to explain the differences and unrecorded adjustments on many blogs. BUT never has he bothered to explain).
With the current BEST surface temperature slanging matches raging on the anti AGW blogs all eyes seem to be turning to the satellite record and opinions seem to suggest that these results are what everyone should be usingas the gold standard (mainly because they only show the last 8 year and these have a cooling trend!!)
What goes up must (in earth orbit) eventually come down.
NOAA-15 was once the satellite producing the temperature records (from 1998) however as the hardware progressively fails the data from the AQUA satellite has been used (data available from 2002)
This gave a 6 year overlap where the temperatures could be compared and corrected. This, according to Leif Svalgaard is what happens with the TSI measurements for solar activity.
My complaint is that there is a LARGE error in data between AQUA and NOAA-15 and no attempt to reconcile the differences is made or explanations given.
Indeed The UAH team handling the data seem to adjust data at a whim.
For example: for channel 05 AQUA between the dates of 2010-07-03 and 2011-10-01 data missing in the earlier plot suddenly appeared in the later plot (from 2009-02-01 to 2009-02-03 and on 2010-11-25 and 2010-11-26 Why and how? Also in my data the earlier records were one day adrift !! (could have been me however)
People are quibbling about discrepancies of 0.12 K/decade but looking at the comparison between NOAA-15 data and AQUA this 0.12K/decade is the discrepancies produced by the two satellites and modified by the same team.
Chan 05
.

From the above plot during the overlap period:
NOAA warming is 3.27e-5K/day = 0.119K/decade
AQUA warming is -1.95e-5K/day = -0.0712K/decade
Also of interest is the two plots for the same series but obtained at different times red and blue in the plot these seem to have been revised without explanation (by up to .08K)
Looking at CH 4 data, the current data on their web site runs from 2002 to 2008 (with the last 6 monts failing) The data that was available (NOAA?) went from 1998 to 2011 and despite this being the longer record is not used on their Discover website.

Again the slope over the valid overlap period is:
AQUA 1.0404e-5K/day = 0.0380K/decade
NOAA 1.1879e-4K/day = 0.434K/decade
Another series CH06

AQUA -4.2323e-5K/day = -0.154K/decade
NOAA -1.7595e-4K/day = -0.642K/decade
Chan 10

AQUA -6.59e-5K/day = -0.2345K/decade
NOAA -9.58e-4K/day = -0.3411K/decade

AQUA -2.1174e-4K/day = -0.754K/decade
NOAA -1.4831e-4K/day = -0.528K/decade
Another plot shows that CHLT (NOAA defunct) and CH04 (recently AQUA defunct) had peaks and troughs occurring at the same time. However comparing CH04 to Sea Surface temperature the temperature of the sea changes BEFORE the air temperature by a couple of months. HOW?

Absolute temperature differences
( CH4 NOAA) - (CH4 AQUA)=-2K
( CH5 NOAA) - (CH5 AQUA)=-0.11K
( CH6 NOAA) - (CH6 AQUA)=-0.99K
( CH10 NOAA) - (CH10 AQUA)=-0.279K
( CH13 NOAA) - (CH13 AQUA)=0.062K
There seems to be many more problems with satellite temperatures than with surface temperatures. Why then are these held up as being the golden standard???
With the current BEST surface temperature slanging matches raging on the anti AGW blogs all eyes seem to be turning to the satellite record and opinions seem to suggest that these results are what everyone should be usingas the gold standard (mainly because they only show the last 8 year and these have a cooling trend!!)
What goes up must (in earth orbit) eventually come down.
NOAA-15 was once the satellite producing the temperature records (from 1998) however as the hardware progressively fails the data from the AQUA satellite has been used (data available from 2002)
This gave a 6 year overlap where the temperatures could be compared and corrected. This, according to Leif Svalgaard is what happens with the TSI measurements for solar activity.
My complaint is that there is a LARGE error in data between AQUA and NOAA-15 and no attempt to reconcile the differences is made or explanations given.
Indeed The UAH team handling the data seem to adjust data at a whim.
For example: for channel 05 AQUA between the dates of 2010-07-03 and 2011-10-01 data missing in the earlier plot suddenly appeared in the later plot (from 2009-02-01 to 2009-02-03 and on 2010-11-25 and 2010-11-26 Why and how? Also in my data the earlier records were one day adrift !! (could have been me however)
People are quibbling about discrepancies of 0.12 K/decade but looking at the comparison between NOAA-15 data and AQUA this 0.12K/decade is the discrepancies produced by the two satellites and modified by the same team.
Chan 05
.

From the above plot during the overlap period:
NOAA warming is 3.27e-5K/day = 0.119K/decade
AQUA warming is -1.95e-5K/day = -0.0712K/decade
Also of interest is the two plots for the same series but obtained at different times red and blue in the plot these seem to have been revised without explanation (by up to .08K)
Looking at CH 4 data, the current data on their web site runs from 2002 to 2008 (with the last 6 monts failing) The data that was available (NOAA?) went from 1998 to 2011 and despite this being the longer record is not used on their Discover website.

Again the slope over the valid overlap period is:
AQUA 1.0404e-5K/day = 0.0380K/decade
NOAA 1.1879e-4K/day = 0.434K/decade
Another series CH06

AQUA -4.2323e-5K/day = -0.154K/decade
NOAA -1.7595e-4K/day = -0.642K/decade
Chan 10

AQUA -6.59e-5K/day = -0.2345K/decade
NOAA -9.58e-4K/day = -0.3411K/decade
| Chan 13 |

AQUA -2.1174e-4K/day = -0.754K/decade
NOAA -1.4831e-4K/day = -0.528K/decade
Another plot shows that CHLT (NOAA defunct) and CH04 (recently AQUA defunct) had peaks and troughs occurring at the same time. However comparing CH04 to Sea Surface temperature the temperature of the sea changes BEFORE the air temperature by a couple of months. HOW?
( CH4 NOAA) - (CH4 AQUA)=-2K
( CH5 NOAA) - (CH5 AQUA)=-0.11K
( CH6 NOAA) - (CH6 AQUA)=-0.99K
( CH10 NOAA) - (CH10 AQUA)=-0.279K
( CH13 NOAA) - (CH13 AQUA)=0.062K
Conclusion
2011/11/02
Schnare snared, Horner cornered. ATI Gate?
Two very "interesting documents from the UVa
http://www.ucsusa.org/assets/documents/scientific_integrity/ATI-UVA-support-memorandum.pdf
http://www.ucsusa.org/assets/documents/scientific_integrity/ATI-UVA-Kast-affidavit.pdf
original here:
http://wattsupwiththat.com/2011/11/02/michael-mann-wades-into-the-uva-thicket-as-intervenor/#comment-785765
Schnare seemingly lies about his employment
Schnare and Horner show signs of illegally releasing Mann Emails despite agreeing not to share!
2011/09/21
WUWT Revisionism double standards - updated
Richard Allan says: September 20, 2011 at 9:27 am
I was surprised that this paper was mis-interpreted as suggesting negative cloud feedback. This is a basic error by the author of the post that has been highlighted by many contributors including Roy Spencer.
REPLY: Dr. Allan, thank you for visiting and for your correction. Please note that I’ve made an update to the post, removing the word negative from the headline and including why I interpreted the paper to demonstrate a negative feedback for clouds. I welcome your thoughts. It seems to me that if clouds had a positive feedback, the dips in 1998 and 2010 in your figure 7 would be peaks rather than deep valleys.
...- Anthony
Bishop Hill and the skeptical cookbook
Posted on September 20, 2011 by Anthony Watts
Oh this is fun, Bishop Hill catches John Cook’s “Skeptical Science” in a revisionism gaffe using The Wayback Machine.
===========================
And of course the factual post converted to a "learning" exercise:
Its snowing CO2 in the antarctic!!
http://wattsupwiththat.com/2009/06/09/co2-condensation-in-antarctica-at-113f/
My post on Curry point out that watts and his ilk have been demanding peer review by blog. They get it with Best ... and then complain bitterly about Best pre-publishing - you just cannot win!
thefordprefect
Watts
you/your accolytes have been calling for peer review by blog for a very long time (recent postings):
Peer review is dead, long live blog review
Posted on September 21, 2011 by Anthony Watts
By Marc Hendrickx writing in ABC’s The Drum
An opportunity for online peer review
Posted on March 27, 2011 by Anthony Watts
I have been asked to present this for review by readers here, and to solicit critical comments for the purpose of improving the presentation.
Now, apart from the press release what is the difference with the BEST release?
From my reading the press release is all about try to stop them misrepresenting the information (as happened with the CRU emails).
Why are you so critical of best when they seem to be doing what you want (e.g. listening to McIntyre)?
2011/09/19
More on Bart, FFTs and Cloud vs temperature
To me it seems that the plot has been lost on CA were discussions revolve around FFTs iFFT convolutions etc.
Is there a relation ship between cloud (Net_tot-SW_clr) and temperature or temperature and cloud?
How about a few simple plots:
The first uses data filtered with a Hodrick-Prescott filter of 1 and plots temperature anomaly against (Net_tot-SW_clr) sorted .
 The second removes any filtering:

As can be seen the is a slight rising trend.
So now reverse the axis and plot cloud cover vs temperature anomaly (sorted) These are Duff!!

So there does seem to be a temperature and (Net_tot-SW_clr) relationship. But which is the forcing????
Is there a relation ship between cloud (Net_tot-SW_clr) and temperature or temperature and cloud?
How about a few simple plots:
The first uses data filtered with a Hodrick-Prescott filter of 1 and plots temperature anomaly against (Net_tot-SW_clr) sorted .


As can be seen the is a slight rising trend.
So now reverse the axis and plot cloud cover vs temperature anomaly (sorted) These are Duff!!


So there does seem to be a temperature and (Net_tot-SW_clr) relationship. But which is the forcing????
2011/09/12
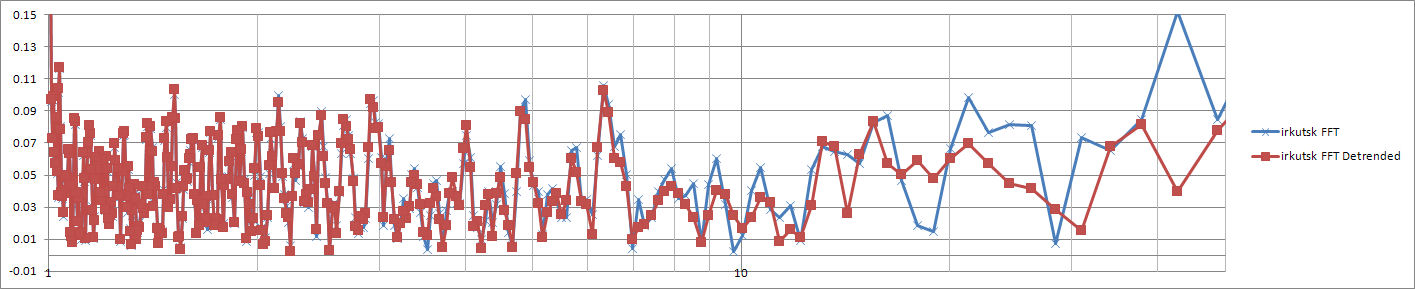
FFTs Cloud feedback and Stuff
Many "sums" have been done using FFTs and convolution.
It started out with Spencer:


 However there seems to me to be problems with all of this.
1. the data being used is from 10 years only
2. the data from clear to cloudy sky is not simultaneous
3. the data is average over 1 month so can never be safely used to subtract clear from cloudy - the data is smeared over 1 month and can never be data from the same region.
3a. Albedo of soil and water are very different- cloud over water will show a large TOA flux difference wheras the cloud over land will show less outward going flux.
water albedo= 0.02 approx (at some angles)
ground albedo = 0.1 to 0.5
Clouds albedo = 0 to 0.8
Wiki
4. What about the "insulating" effect of clouds at night. Shouldn't this be included in any flux calculations?
5. There is no way the data available from Spencer/Dessler/Bart can show the accurate change in flux due to clouds
the Plots below are simple spectrums using the FFT function in excel. Note that any thing over 60 years period has very little resolutuion. and these are from 200 year records not 10 year!!.
Also when doing FFT on a non infinite series the trend should be removed before the fft transform is applied as the termination of data at either end causes problems. Using a FFT windowing function will also improve performance.


Ocean albedo calc
http://snowdog.larc.nasa.gov/jin/rtset.html
Measurement of ground albedo
http://www.cuepe.ch/html/biblio/pdf/ineichen%201990%20-%20ground-reflected%20radiation%20and%20albedo%20(se).pdf
Variation/validation of Albedo
http://citeseerx.ist.psu.edu/viewdoc/download?doi=10.1.1.64.6930&rep=rep1&type=pdf
It started out with Spencer:

Changed to this with "Bart"


1. the data being used is from 10 years only
2. the data from clear to cloudy sky is not simultaneous
3. the data is average over 1 month so can never be safely used to subtract clear from cloudy - the data is smeared over 1 month and can never be data from the same region.
3a. Albedo of soil and water are very different- cloud over water will show a large TOA flux difference wheras the cloud over land will show less outward going flux.
water albedo= 0.02 approx (at some angles)
ground albedo = 0.1 to 0.5
Clouds albedo = 0 to 0.8
Wiki
4. What about the "insulating" effect of clouds at night. Shouldn't this be included in any flux calculations?
5. There is no way the data available from Spencer/Dessler/Bart can show the accurate change in flux due to clouds
the Plots below are simple spectrums using the FFT function in excel. Note that any thing over 60 years period has very little resolutuion. and these are from 200 year records not 10 year!!.
Also when doing FFT on a non infinite series the trend should be removed before the fft transform is applied as the termination of data at either end causes problems. Using a FFT windowing function will also improve performance.

Comparison between data with a trend and detrended data:
Ocean albedo calc
http://snowdog.larc.nasa.gov/jin/rtset.html
Measurement of ground albedo
http://www.cuepe.ch/html/biblio/pdf/ineichen%201990%20-%20ground-reflected%20radiation%20and%20albedo%20(se).pdf
Variation/validation of Albedo
http://citeseerx.ist.psu.edu/viewdoc/download?doi=10.1.1.64.6930&rep=rep1&type=pdf
2011/09/08
More on IR water penetration depth
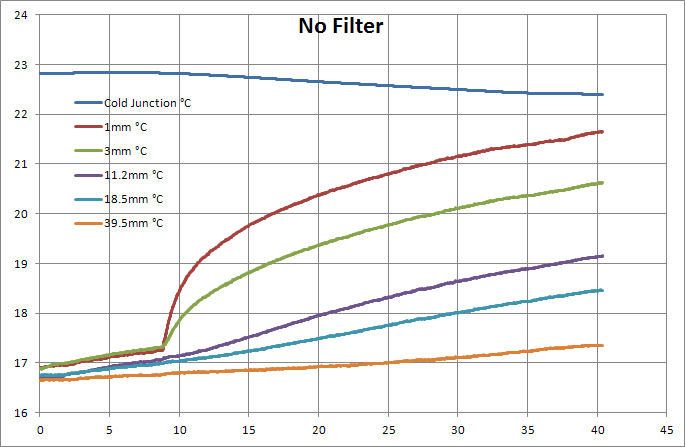
Using a similar setup to the previous posting different filtering methods have been used to see if pentration depth can be tested.
In test 1 a heat sink was placed in the tube preventing any visible light entering the water. The stable temperature of the heatsink was 100C The tube was ventilated from just above the transparent seal above the water to just below the heatsink. at the top of the tube. The bulk of radiation entering the water would be radiated from the bottom of the heatsink
In test 2 the heat sik was replaced with a 1cm deep tray of water. This should effectively remove any LW IR leaving only visible light. The tube was again ventilated.
The temperature plots with depth are shown together with the rate of change of temperature with depth.
Not very conclusive although it appears that 100C blackbody is significantly attenuated below 6mm of depth. (the final 2 thermocouples showing the leakage of the thermos heating the water (possibly)
The visible light seems to be adding significantly to the water at a depth of 55mm.
Note that there seems to be no explanation for the dips in reading of temperature. The apparatus was not disturbed and no light change occurred. (one of the dips - at 24mins was caused by the filter water being replaced with cool water)


2012-08-12

2011/09/04
McIntyre and Acolyte Vigilantyism
The unsupported accusations against Jones, Mann etc continues unabated on the "auditing " site
"Did he add any "
"The prima facie evidence "
"this particular finding of the Inquiry Committee clearly does not follow "
"Watch the pea here, "
"It seems to me that “Professor” Jones "
"I use *might* because it is still not clear that any offense was actually "
"The academics did not describe the conduct as it was. Instead, they misdescribed the conduct and then made findings unsupported by the evidence"
etc.
etc.
Never mind the evidence - Hang em High:
"thefordprefect Posted Sep 4, 2011 at 5:38 AM
Your comment is awaiting moderation.
Trial by Lynch Mob is just sooo American
------------------
thefordprefect Posted Sep 4, 2011 at 5:54 AM
Your comment is awaiting moderation.
Wiki
Lynching is an extrajudicial execution carried out by a mob, often by hanging, but also by burning at the stake or shooting, in order to punish an alleged transgressor, or to intimidate, control, or otherwise manipulate a population of people. It is related to other means of social control that arise in communities, such as charivari, riding the rail, and tarring and feathering. Lynchings have been more frequent in times of social and economic tension, and have often been means used by the politically dominant population to oppress social challengers.
=================
Then of course there is the poor Phil post.
This is just unbelievable. Apparently Jones lost kgs of weight, and aged 10 years just to comply with media management instigated by Neil Wallis.
This is a truly despicable post by someone who claims only to want the truth!!!!
================
If McIntyre is really a climate auditor then should he not be auditing papers such as the Spencer & Braswell paper?? The Cern Cloud report???
No, Perhaps his cognitive function has been clouded by hatred of all things Mann and Jones!
thefordprefect Posted Sep 4, 2011 at 6:21 AM
Your comment is awaiting moderation.
McIntyre if you really are a climate auditor then should he not be auditing papers such as the Spencer – Braswell paper?? The Cern Cloud report???
There are so many from both sides.
I suppose you will be reposting all the hide the decline emails soon. It must be over a week since you mentioned these!!!!!
=================
thefordprefect
Posted Sep 7, 2011 at 7:13 AM
Permalink
Reply
Your comment is awaiting moderation.
Collected here are data from different past plots on the spencer and braswells discover page
There are many revisions:
Some due to satellite changes (but if temperatures from satellites are accurate then shouldn’t temperature a a fixed altitude be the same from satellite to satellite?)
Some just terminate
Some are just revised by a few 100ths K why? if this is such a clean data source?
Satellites do not give a global snapshot at a time they are a moving window taking hours? days? to complete a global sweep
Is the satellite data corrected for local time?
If satellites recording temp are so variable how can anyone use them to determine the effect of clouds? As far as I’m aware the global temperature derived from satellites is adjused for cloud cover!!!!
Temperatures are derived from someone’s models that derive temperature from radiation+mods for intervening layers etc. Is this really better than surface measurements
2011/08/22
How far does IR penetrate Water? (failed?)
An attempted experiment to measure how far IR penetrates (tap) water (UK variety)
Problem points:

Thermocouples are placed away from the light input at distances below the water surface of
2 runs made with and without the IR pass (visible stop) filter:
These produce 2 outputs:


The Filter
Using a camera as a lightmeter and looking at the halogen source the filter reduces the exposure (mainly visible) by a factor of 110.
The light source.
20 watts = perhaps 10 watts into tube and 1 watt (unfiltered) into water
What they show
The spectrum of the bulb is not generated from a hot enough filament. The heating effect of filtered and unfiltered light is very similar.
Unfiltered heating does not predominate at greater depths (it is virtually the same as IR "only")
At a 39mm depth heating effect has little effect over the leakage throught the faulty vacuum flask.
What I would have thought.
Despite the limitations I would have expected significantly greater heat imput (faster temp rise ) at depth with unfiltered light.
Suggestions?
Problem points:
- The wide necked Vacuum flask turns out to be a wide necked flask!
- The high frequency cut off of the IR pass filter is not known (this was purchased from Edmund Optical)
- The High intensity Low votage Halogen lamp is not the sun and has a peak output at the red end of solar spectrum (3500K cf 5000K)
Thermocouples are placed away from the light input at distances below the water surface of
- 1mm
- 3mm
- 11.2mm
- 18.5mm
- 39.5mm
2 runs made with and without the IR pass (visible stop) filter:
These produce 2 outputs:


The Filter
Using a camera as a lightmeter and looking at the halogen source the filter reduces the exposure (mainly visible) by a factor of 110.
The light source.
20 watts = perhaps 10 watts into tube and 1 watt (unfiltered) into water
What they show
The spectrum of the bulb is not generated from a hot enough filament. The heating effect of filtered and unfiltered light is very similar.
Unfiltered heating does not predominate at greater depths (it is virtually the same as IR "only")
At a 39mm depth heating effect has little effect over the leakage throught the faulty vacuum flask.
What I would have thought.
Despite the limitations I would have expected significantly greater heat imput (faster temp rise ) at depth with unfiltered light.
Suggestions?
2011/07/31
More Arctic Sea Ice!
The plots below suggest that the rate of decrease is the same as previous years. However the starting area was lower over winter. This suggests a minimum extent of 4.6e6 sqkm
However comparing the 2 images from 2011 and 2007 created by
http://arctic.atmos.uiuc.edu/cryosphere/
The seems to be more chance of a lower minimum than 2007 if the freeze does not start earlier.


However comparing the 2 images from 2011 and 2007 created by
http://arctic.atmos.uiuc.edu/cryosphere/
The seems to be more chance of a lower minimum than 2007 if the freeze does not start earlier.


2011/07/20
McIntyre - the downward spiral into the gutter + more posts that may never make it!
Just so much unsubstantiated crud. Climate AUDIT should audit itself!
Notice how McIntyre never ACTUALLY accuses anyone - innuendo is sufficient for the accolytes to pick it up and embelish it.
"Covert” Operations by East Anglia’s CRU
Steve McIntyre Posted Jul 15, 2011 at 7:47 AM
I wonder how much Outside Organisation contributed to misdirecting the police about international security services, and thus the involvement of Counter-Terrorism officers.
Posted Jul 14, 2011 at 3:47 PM
Remember the apparent disinformation about Russian intelligence agencies. 18 months later, there isn’t (to my knowledge) a shred of evidence for this theory. Nonetheless, this was fed into the press and quickly accepted as gospel by the climate science community. Remember Pierrehumbert’s fulminations at Dot Earth about this. And Andrew Weaver’s talk about international conspiracy. I wonder how much of this stemmed from Outside Organisation’s intervention.
Posted Jul 15, 2011 at 7:02 AM
I agree that the reference to “mobile phone conversations” – of which there isn’t a shred of evidence and was not under discussion at the time = suggests (but doesn’t prove) a connection to Neil Wallis and Outside Organisation, as this surely seems like a specific embellishment that they would have added to the legend being disseminated to the climate science community and to the public.
R.S.Brown Posted Jul 14, 2011 at 7:36 PM
It takes little, if any, imagination to join up the dots between Mr. Willis’s employment by the University of East Anglia’s (UEA) Climate Research Unit (CRU) and the spectacular failure of the East Anglia police in investigating the who, what, when and where of the unauthorized release of the Climategate materials
Steve McIntyre Posted Jul 14, 2011 at 10:10 PM
One of the main elements of the disinformation campaign in early December was what may have been the planting of stories that blamed Climategate on Russian security elements. One of the pieces of “evidence” that supposedly pointed to “sophisticated” hackers was East Anglia’s claims to have had a “sophisticated” security system – a claim that seems to be viewed now as a fabrication. I wonder how much Outside Organisation had to with disseminating the idea of “Russian security services”.
Posted Jul 18, 2011 at 5:12 PM
As I reported last year, I was interviewed by a Counter Terrorism officer who had been seconded to Norfolk Constabulary to work on the East Anglia emails. I wonder if Neil Wallis had any involvement in getting Counter Terrorism officers working on East Anglia emails rather than Al Qaeda or such.
pat Posted Jul 17, 2011 at 6:44 PM
the local norfolk newspaper, Eastern Daily Press, which covered wallis and UEA (only to give cover) is owned by a big media company called Archant. here’s the Board:
Richsrd Jewson, Chairman
He is HM Lord Lieutenant of Norfolk and also Chairs the Council for the University of East Anglia.
Richard chairs the remuneration and nominations committees
Adrian Jeakings Chief Executive
He is a governor of Norwich School and a member of the Audit Committee of the University of East Anglia…
Mike Walsh Director
He has had extensive involvement in the charity sector as Worldwide Board member of WWF, Vice Chairman of the British Red Cross, and completed his six-year term as Chairman of the UK Disasters Emergency Committee in March 2011.
http://www.archant.co.uk/about_board.aspx
mpaul Posted Jul 18, 2011 at 9:49 AM
It would seem that one of Wallis’ singular talents was is knowing how to pay-off the Police http://english.alarabiya.net/articles/2011/07/17/158069.html . This raises important questions about the unusual and unaccounted for payment by UEA to the Norfolk Police Authority http://bishophill.squarespace.com/blog/2011/6/22/whats-up-with-norfolk-police.html
. There needs to be a call for a complete explanation of Wallis’ activities while employed by the UEA.
my latest which seems to be in moderation again!!! I'm sure the only blogs to not censor comments (wuwt and ca) cannot be selecting posts!
Walt Man Posted Jul 20, 2011 at 12:48 PM
How do you KNOW that Neil Wallis was requested explicitly by UEA as you IMPLY in your header.
As far as any information is available UEA Employed Outside Organisation to get their point of view to the press.
Wallis was surely provided by Outside Organisation as a suitable person from OO to do the requested work. NOBODY KNEW that he was implicated in hacking at THAT TIME. Can you prove differently?
When your “mineral” prospecting company requires an accountant, do you check the future to see if the accountant provided by an accounting firm will be or has been (but not discovered yet) fiddling the books of another organisation?
Your talents must be amazing, or you are making unsubstantiated accusations!
----
Eric Posted Jul 20, 2011 at 1:19 PM
I read no such implication in the header. Wallis is toxic and we now have evidence that he was hired, through OO, as UEA’s reputation manager. That is all that the header says, and that is enough to merit further investigation.
----
thefordprefect Posted Jul 20, 2011 at 4:40 PM
Your comment is awaiting moderation.
Eric Posted Jul 20, 2011 at 1:19 PM I read no such implication in the header. Wallis is toxic and we now have evidence that he was hired, through OO, as UEA’s reputation
University of East Anglia had used Neil Wallis”
“The University of East Anglia was not the only UK institution that employed Wallis”
“That their first instinct was to seek counsel from a former News of the World editor”
“reputation management” problem and the sort of advice that they needed could be obtained from a former News of the World editor (let alone one with Wallis’ baggage).”
Only the first statement has an ounce of truth. The rest are just wrong – the UEA employed OO, OO provided their consultant Wallis. As said above “When your “mineral” prospecting company requires an accountant, do you check the future to see if the accountant provided by an accounting firm will be or has been (but not discovered yet) fiddling the books of another organisation?”
=======
Another never to emerge from moderation perhaps!!!
-Walt Man Posted Jul 22, 2011 at 7:49 AM
Your comment is awaiting moderation.
Martin Brumby Posted Jul 22, 2011 at 7:10 AM
Blimey Mate, you are now accusing the notw as a bunch of dishonest hacks before they were even KNOWN to be such.
My company has employed a firm of accoiuntants. I do not KNOW who is actually doing my accounts – it varies from year to year. They certainly do not send me the CVs of this person. The CV is not even likely to say “I have worked in phone hacking” is it? I put my trust in the accountants company. Not the tea boy who probably presses the button on the computer to roll out the 2 accounts documents and the submission to HMRC. I even managed to do it last year (saved £900!!)
UEA employed an agency to get their view to the press. OO has/had plenty of famous names on the books. Why should they not trust the person OO allocates to do this simple job? What is so difficult to understand about this?
===============
That one made it - how about this:
thefordprefect Posted Jul 23, 2011 at 4:29 AM | Permalink | Reply
Your comment is awaiting moderation.
Richard Drake Posted Jul 23, 2011 at 2:21 AM | Permalink | Reply
What if the person ‘recruiting’ him for UEA knew some of the darker parts of his past, and that this would guarantee he wouldn’t step out of line? That’s the hunch I’ve had.
ZT Posted Jul 22, 2011 at 10:54 PM | Permalink | Reply
It appears that British officials are selected exclusively for blackmail potential these days. (Similar to the system employed at the UN).
hro001 Posted Jul 23, 2011 at 2:02 AM | Permalink | Reply
It seems that Wallis was … hmmm … not home alone.
“What if”
“Hunch”
“It appears”
“It seems”
Where’ the EVIDENCE for any of this.
I know for a fact Elvis may be alive
It is absolutely certain that area 51 possibly houses alien artifacts
There is incontrovertible evidence that the moon landings were possibly staged!
=====
Off moderation so posted but how long will it last before deletion!?
walt man
Posted Jul 23, 2011 at 5:27 AM | Permalink | Reply
How times change:
Steve McIntyre, posted on Jan 12, 2010 at 11:35 PM
You get to watch somebody named phil jones say that John daly’s death is good news.. or words to that effect.
This leads to indignation that such a comment can be made (no mention that it was presumed a private email.
Now you plaster all over the web comments where it is stated that Jones brush with suicide was a put up job to get the sympathy vote. Did no one see him present his case to parliament – was he shown by Wallis how to starve himself. Did Wallis show him how to dye his hair just the right side of grey to match his pallid complection. Did Wallis give him acting lessons to get just the right amount of quaver in his voice?
YOU PEOPLE AMAZE ME
and just recently
YOU PEOPLE DISGUST ME.
========
Well this got posted then everything got deleted and the whole thread now in disarray. Well done McIntyre!
walt man
Posted Jul 23, 2011 at 7:52 AM | Permalink | Reply
Your comment is awaiting moderation.
Run???? It took almost 3 months for this to surface. Wouldn’t it have been better to say this after perhaps 1 month for maximum impact?
From The Sunday Times February 7, 2010
Professor Phil Jones said in an exclusive interview with The Sunday Times that he had thought about killing himself “several times”. He acknowledged similarities to Dr David Kelly, the scientist who committed suicide after being exposed as the source for a BBC report that alleged the government had “sexed up” evidence to justify the invasion of Iraq.
Richard Drake Posted Jul 23, 2011 at 6:18 AM | Permalink | Reply
The very fact you equate someone’s death with a threat of suicide if someone asks someone too many awkward questions shows the moral vacuum in which you are operating.
What!!!
A natural death. A private comment to others:
“Mike,
In an odd way this is cheering news !”
That’s it, all of IT, how on earth do you misinterpret this comment? The moral vacuum that I work in is that I at least believe that my grandchildren deserve a better world to live in. That those equatorial dwellers deserve a homeland that is inhabitable.
I unfortunately also believe that it is probable that Man can destroy the environment!
2011/06/25
Revisionism in the satellite Temperatures
http://discover.itsc.uah.edu/amsutemps/
Dr. Roy Spencer and Dr. Danny Braswell, NSSTC Control the data
No problem with this (it presumably corrects errors from an older satellite) But if this had been done by CRU/Giss etc. it would have headlined on WUWT and CA with statements that this proves that the data and its controllers cannot be trusted!
One interesting one is CH4 (final plot) thewhole of the last years data (not shown on plot) has been deleted - why?
![]()
![]()
![]()
![]()
![]()
Dr. Roy Spencer and Dr. Danny Braswell, NSSTC Control the data
No problem with this (it presumably corrects errors from an older satellite) But if this had been done by CRU/Giss etc. it would have headlined on WUWT and CA with statements that this proves that the data and its controllers cannot be trusted!
One interesting one is CH4 (final plot) thewhole of the last years data (not shown on plot) has been deleted - why?


Subscribe to:
Posts (Atom)


No…It is evidence of how, outside of the scientific community, people can endlessly debate things that inside the scientific community would quickly and rightly be dismissed as nonsense.
The fact that this is still being debated despite the best attempts by some of us to inject correct science into the debate shows how many people seem unable to distinguish actual science from nonsense. This is particularly true when the nonsense aligns more with what they want to believe than the science does. – Anthony
REPLY: And this Joel, is where you fail miserably. The point of this is education. To learn people must make mistakes. The problem with the “scientific community” is that they poo poo and denigrate people like myself and those who frequent this blog for going through the learning process discussing things they consider off limits. The fact is though, that anyone who maintains a closed mind to re-evaluating anything is a lost soul, capable only of self affirmatiom and confirmation bias.
I could have prevented this post, knowing full well at the outset that it had serious problems, but then, nobody would have learned anything. Unlike you and the team, I prefer to allow such open debate, even if the debate shows just how wrong the idea can be. The real value is in the journey. I refer everyone to the conclusion of this discussion in Willis Eschenbach’s thread A Matter of Some Gravity
You’ve spent hours dominating this thread and the original, and many have learned something from it, some have not. But in honor of your pig-headedness displayed here, I’m closing the thread. The conversation can continue on the Willis essay linked above. Take a 24 hour time out before you try to take command of that thread too. – Anthony
=================
Has anyone changed their view because of this educational exercise?
=================