http://www.nrel.gov/midc/srrl_bms/
NREL Solar Radiation Research Laboratory
Baseline Measurement System BMS
Latitude: 39.742o North Longitude: 105.18o West
Elevation: 1828.8 meters AMSL
Since the previous plots I have downloaded another 4 years of hourly date from 2004 onwards. This of course will give better results
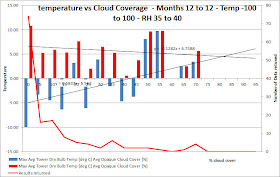
The following plots show : Temperature (max/min) variation with opaque cloud coverage. The data is only counted if :
1. It falls within the month selected.
2. The humidity is within selected limits
3. The cloud coverage is within 5% selected boundary
4. It is sufficiently light that cloud coverage is measurable optically (daylight!)
Each "returned data " count refers to 1 hour slots within the time period selected (months) Some data plots shown are for very sparse data. Any plot point with one point is just about irrelevant and certainly shows no difference in max and min!
The returned data is the max and min for the resuts returned for that period and could therefore show a spurios figure.
Further limitations on time of day would remove the pick-up of minimum at dawn / max after midday.
Dont Know where November went!
It seems that if it is cool then clouds warm even during the day
If it is hot then clouds cool.
Only one location, and very little data for each month but cloud effects on temperature seem not to be as negative (lower temps with more cloud) than others suggest.
Now if there was another 10 years of data from another location then a much better idea of the effect of clouds could be obtained.


No comments:
Post a Comment